LEARN / ARTICLE
How Much Pollution Gets Inside Our Offices?
This post is from a series we started publishing recently on the impact of air pollution on our daily lives. If you haven’t read the previous posts, check them out here:
💡Our Buildings Are Broken
💡How pollution impacts performance at the office
A Quick Review of Air Quality Data Readings
If you’re new to the air quality space, we’ll quickly review some of the numbers and colors you will see.
What do the numbers mean? Nafas measures concentrations of PM2.5 in the air, which are measured in µg/m3. The World Health Organization yearly recommended guideline of PM2.5 exposure for humans is 5 µg/m3. For reference, Jakarta’s average in July 2023 was 47 µg/m3.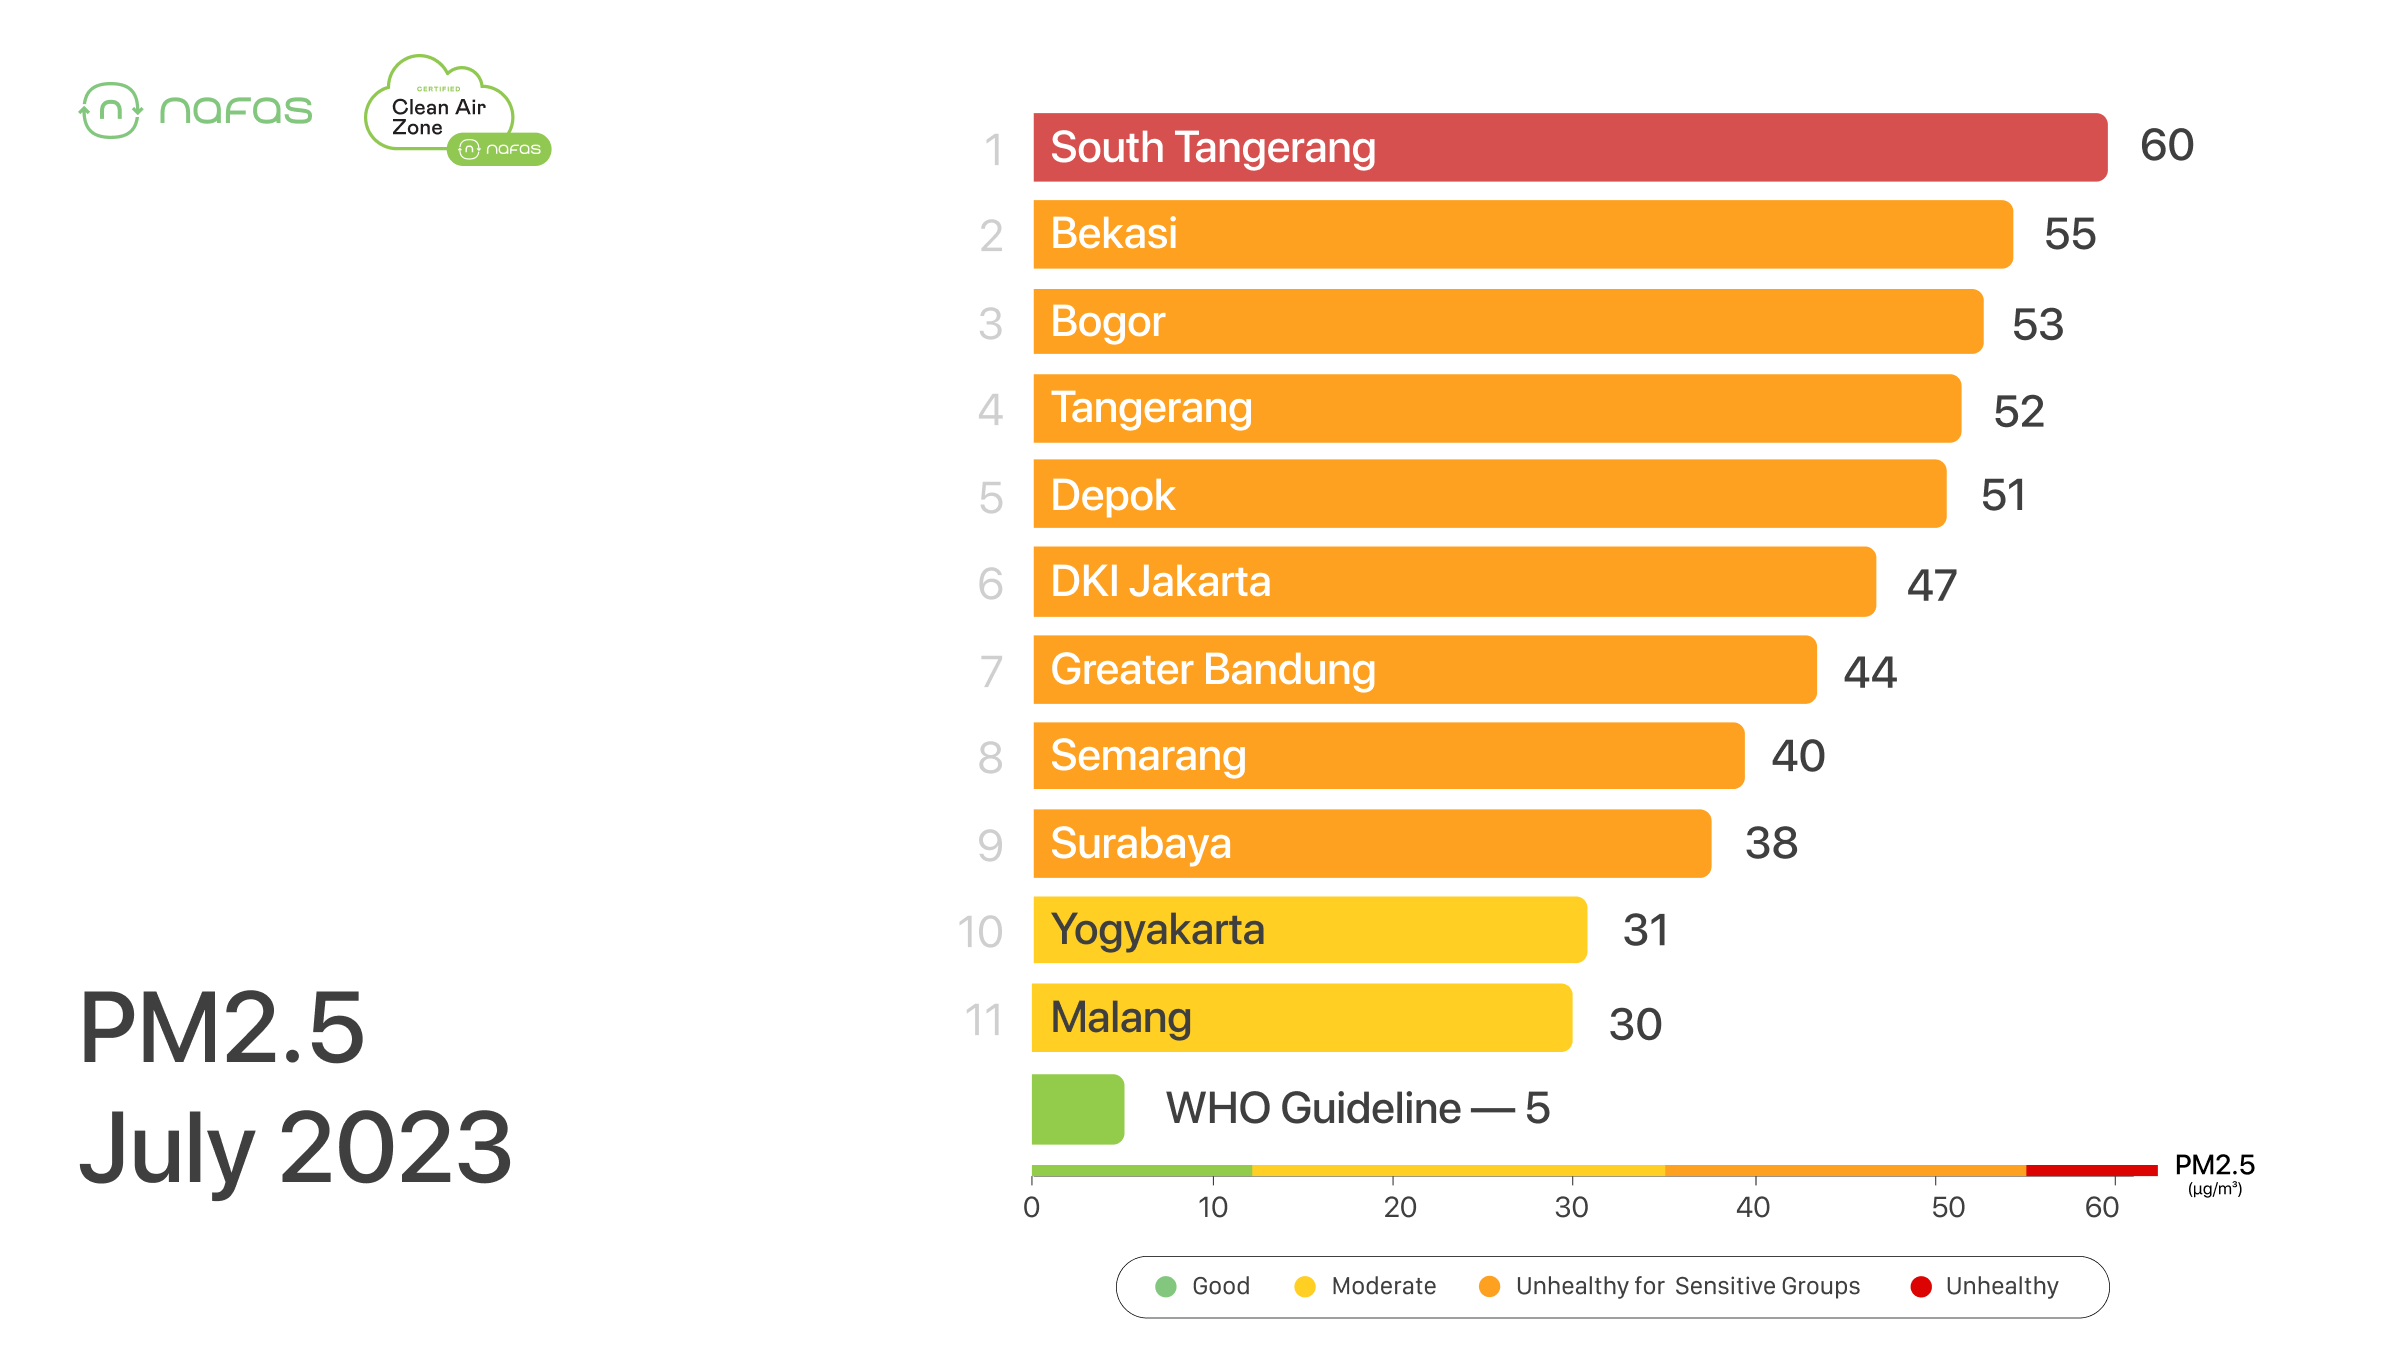
What do the colors mean? Nafas references the US EPA scale for healthy air quality as it is one of the most stringent but also recognized around the world. You can see how the US EPA scale compares to the Indonesian ISPU scale and the Chinese scale below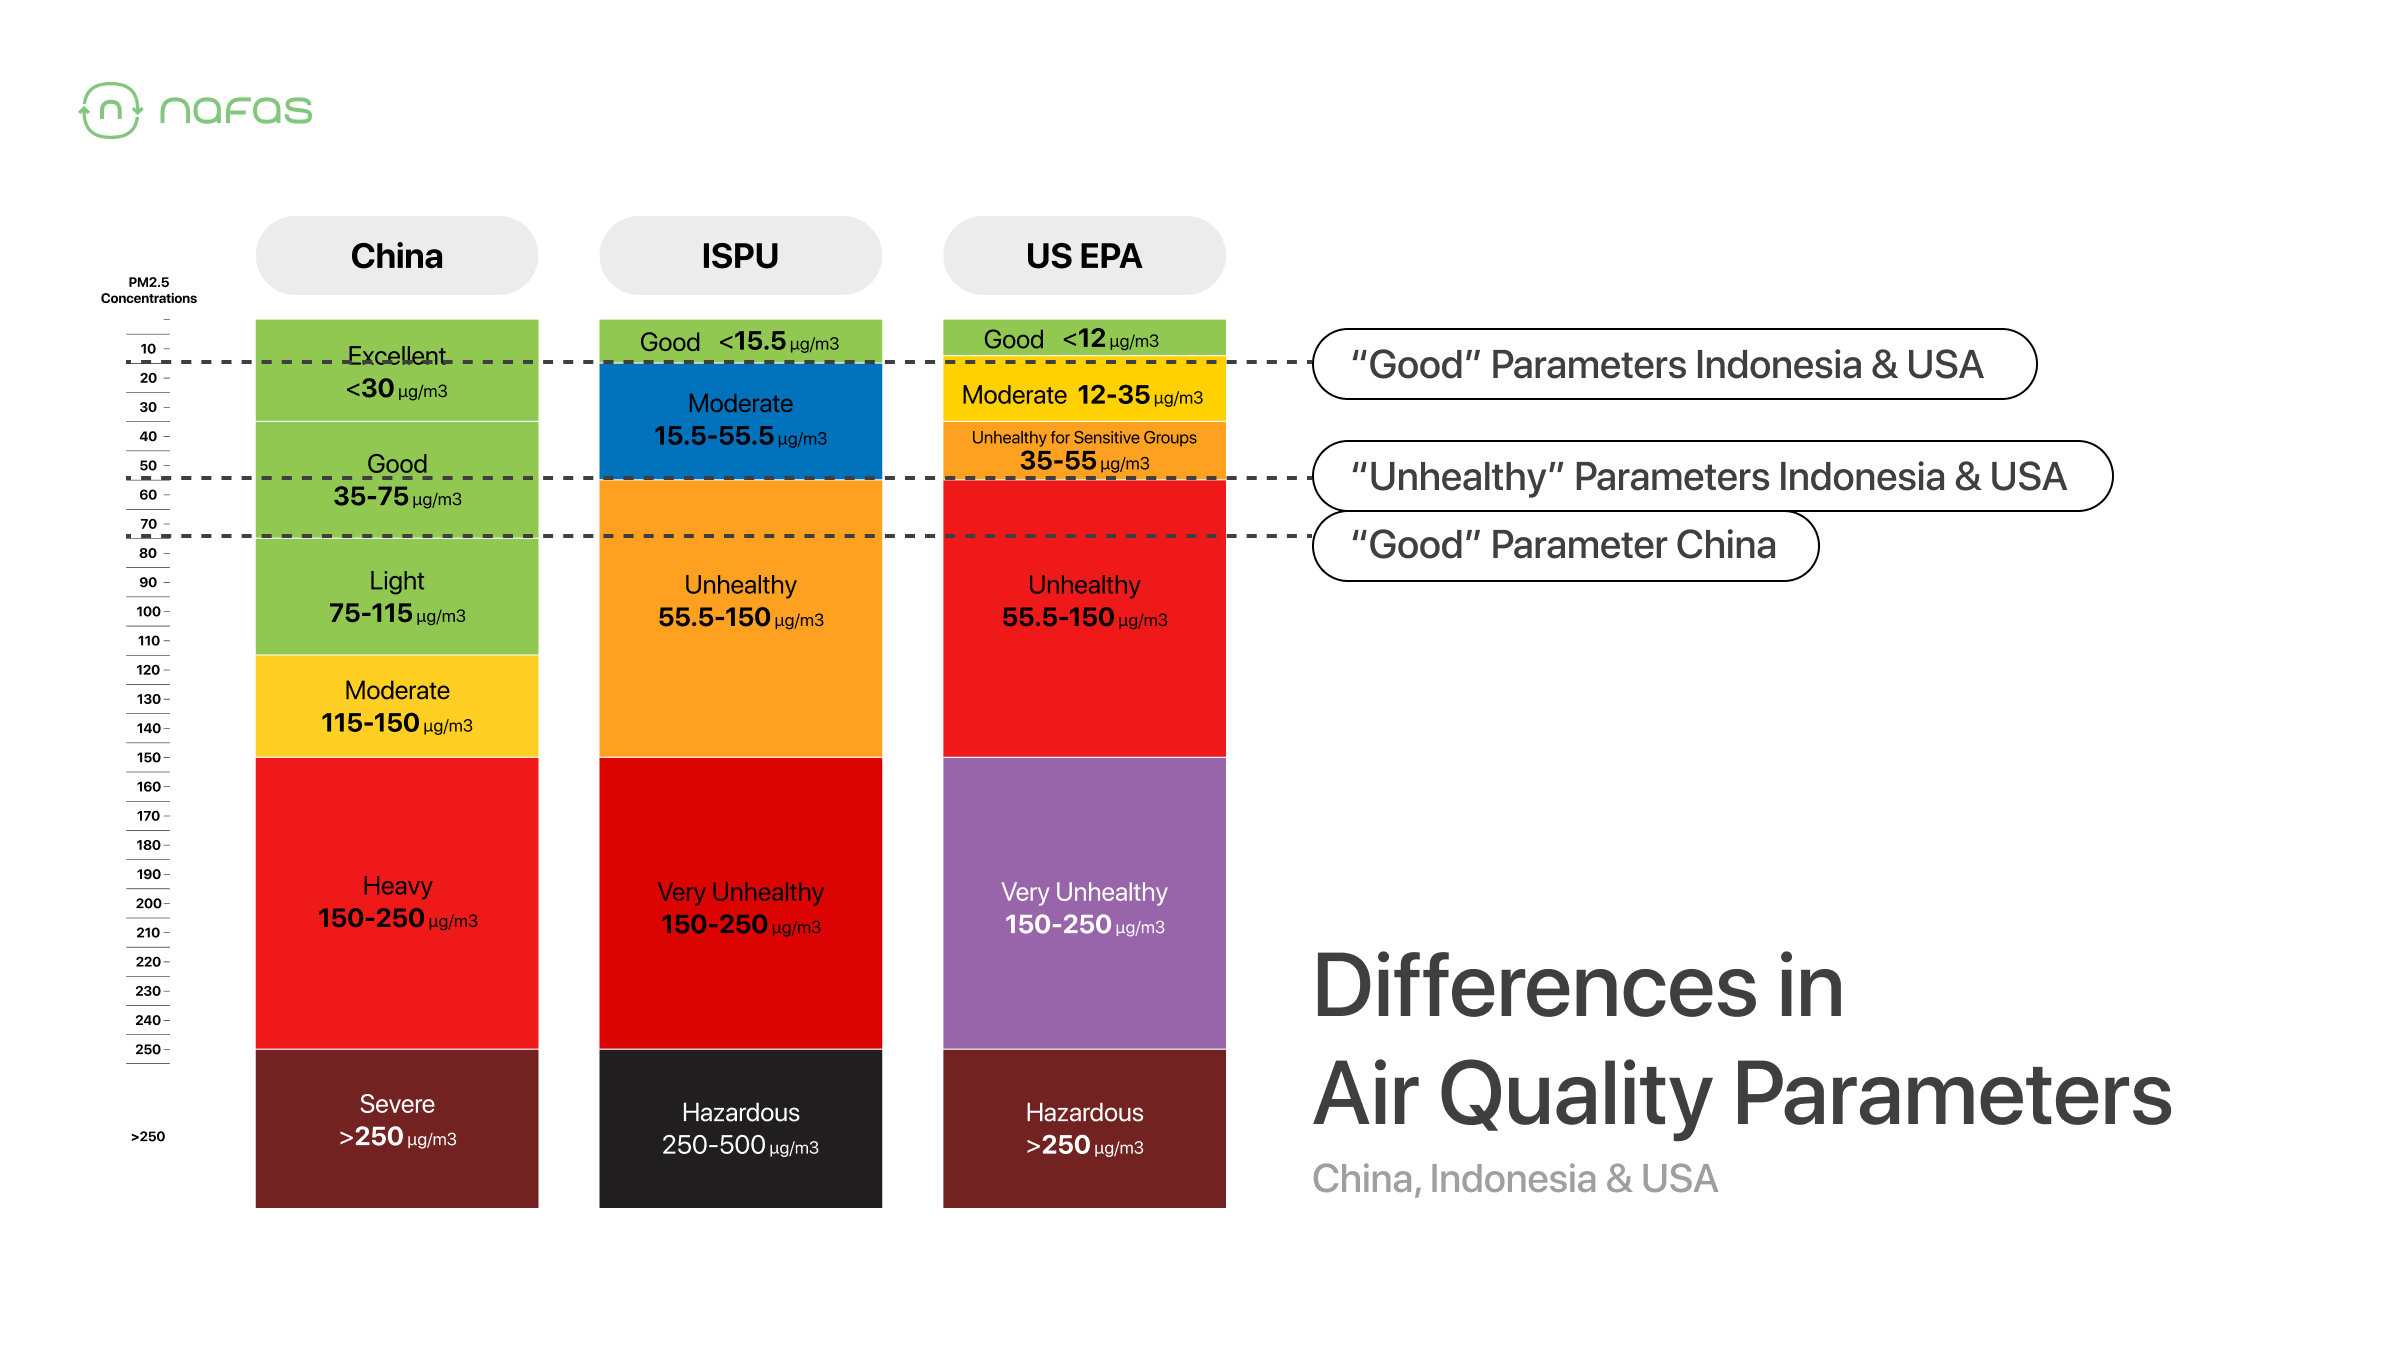
Since you now know how to measure it, let’s take a look at how much pollution from outside actually gets in our buildings.
Indoor Air Pollution - A hidden problem
If you’ve been following Nafas for a while, you know how much we talk about the air pollution outdoors - it’s far above the WHO guideline and poses a risk to our health.
We might think about it when we’re outdoors, but then when we go inside - we stop thinking about it. Once we go inside, we’re not sweating, the temperature is cool and we feel comfortable. There can’t be anything bad inside, right?
Wrong! 😱❌
Indoor air pollution has ALWAYS been a problem for us - we’ve just never had access to the tools and the general knowledge about it. Today, we have access to sensors and air quality monitors that show us just how bad it is.
One of the interesting things that Nafas has discovered, is that in Indonesia and other emerging markets the relationship between outdoor pollution and indoor pollution is near perfect. This means that our buildings allow particles from outside to “leak” inside, which is a problem because once inside there’s no wind that can blow them away.
Let’s see a quick example of what that looks like. Here’s outdoor air quality from June 2023 in SCBD - you can see that there is a lot of variation, it can jump from good to moderate to unhealthy in a very short time span.
Let’s take a look at that chart again, but now let’s add the indoor air quality from an office building inside SCBD from the same time period
You can see that it’s nearly identical.
Yes - the pollution inside the new fancy office building is the same as outside.
Once you pick your jaw up off the table, let’s learn about why this happens.
How Air Pollution Gets Into The Office
In modern office buildings where indoor smoking is banned, there are a few other sources of pollution from within. Perhaps the pantry at the office, somebody sneaking a vape or maybe even dust from furniture, carpets and other indoor items.
But that’s not enough though to fill the office up with pollution at the levels we see. So why does it follow the exact same trend as outside?
The answer is right outside our walls - because the largest source of air pollution inside our offices is, by far, outdoor pollution coming in.
Since we don’t open our windows, how does it make it’s way inside? 🤔
Through the lobby? A small amount? Through the elevators? Also small.
💡 The answer: through our central air system. Our ACs.
Why? 🤨
Simple - the building was designed without proper air filtration systems (like built in air purifiers) which are critical in cities like Jakarta, Bandung, Surabaya where air pollution is high.
The way our buildings work is that over the course of the day, “new” air from outside is pumped into the building to replace the “old” air that is inside. And if the building has poor filtration systems, when pollution outside is really high it means that all of that pollution is coming into your office, workspace or meeting room.
Over the course of the day, it’s being replaced with…. well, whatever’s outside - more pollution 😥
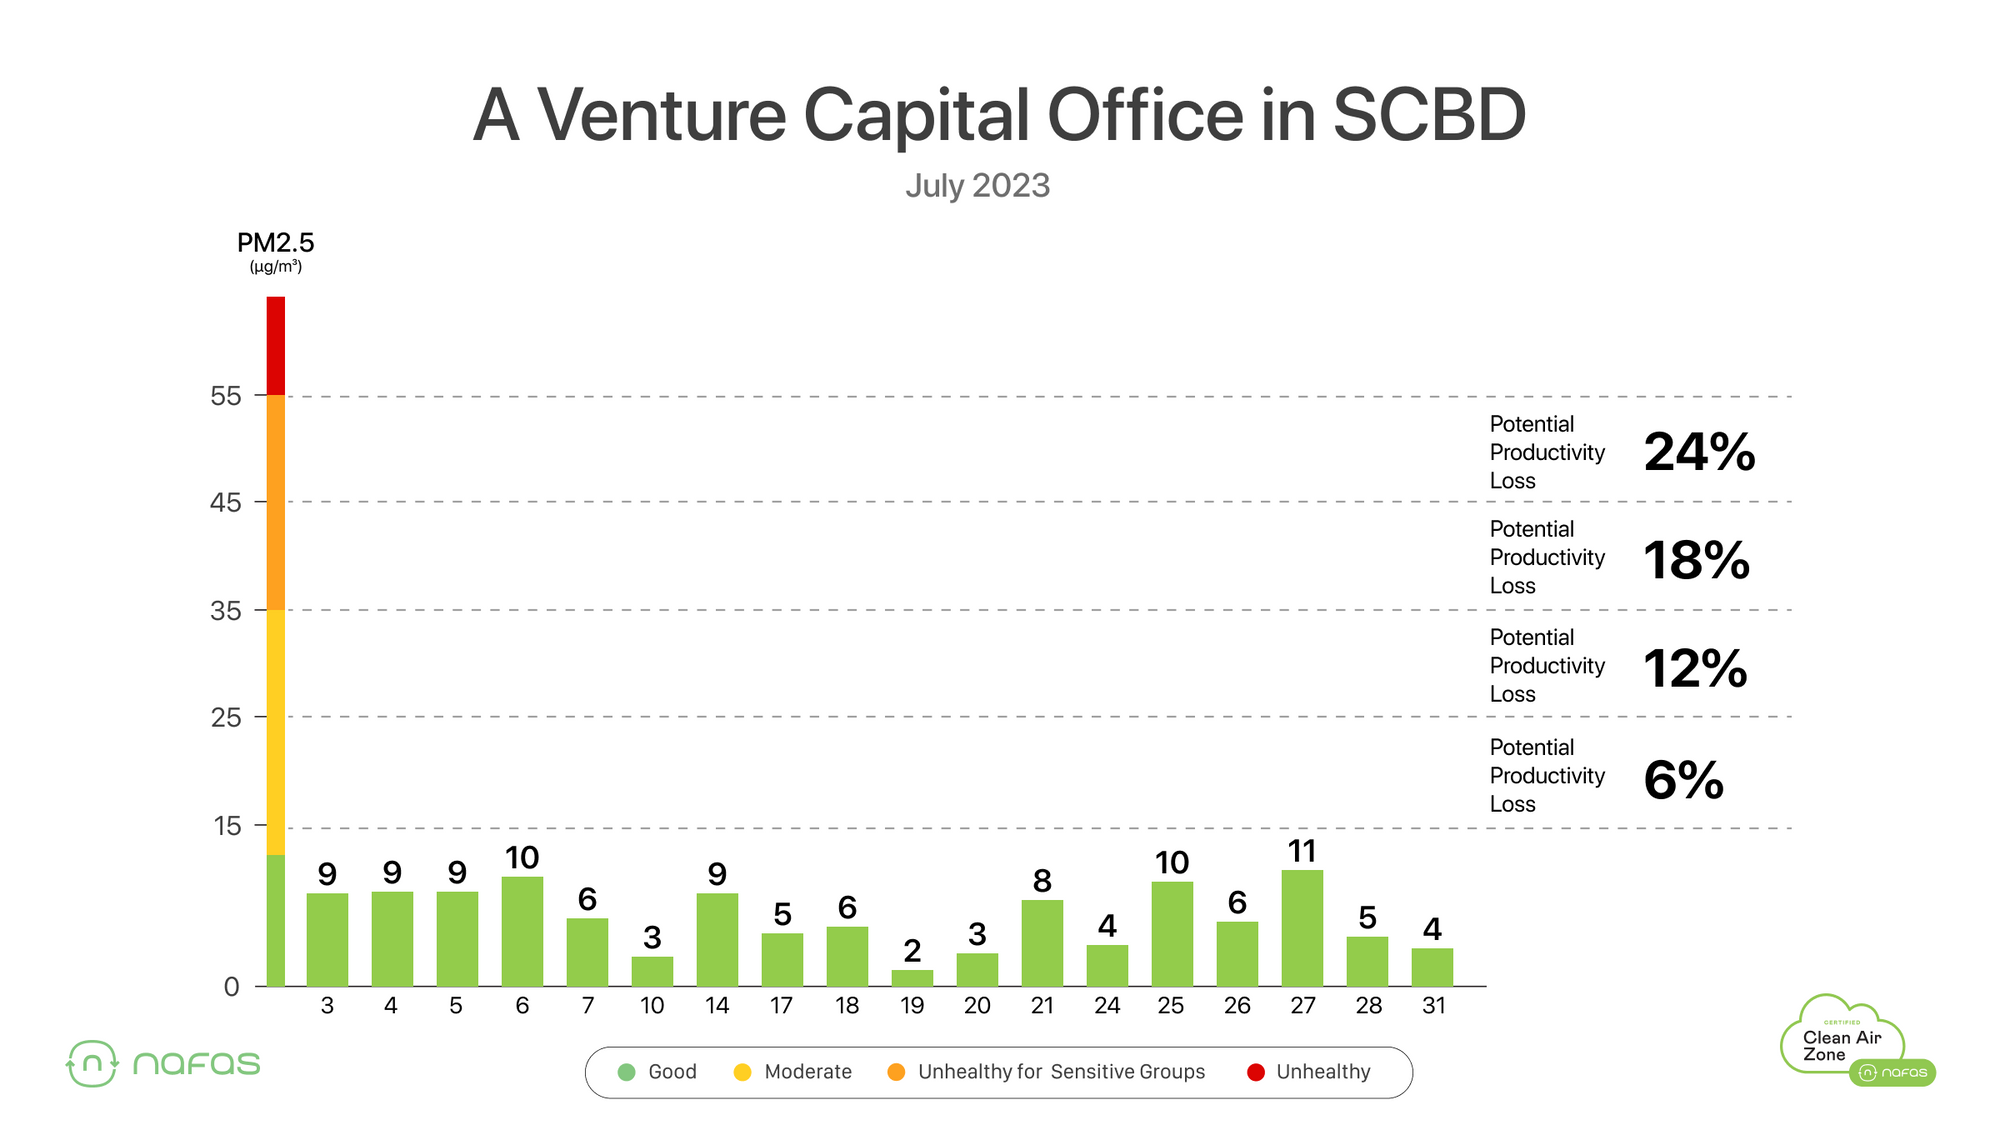
Nafas has designed the proprietary Leakage Index™, which measures the effectiveness of building central air systems and determines just how much pollution “leaks” inside.
Here’s what the Leakage Index looks like at one of the largest Venture Capital firms in Indonesia, in their SCBD office. Remember, that “Good” air quality is considered 12 µg/m3 or below.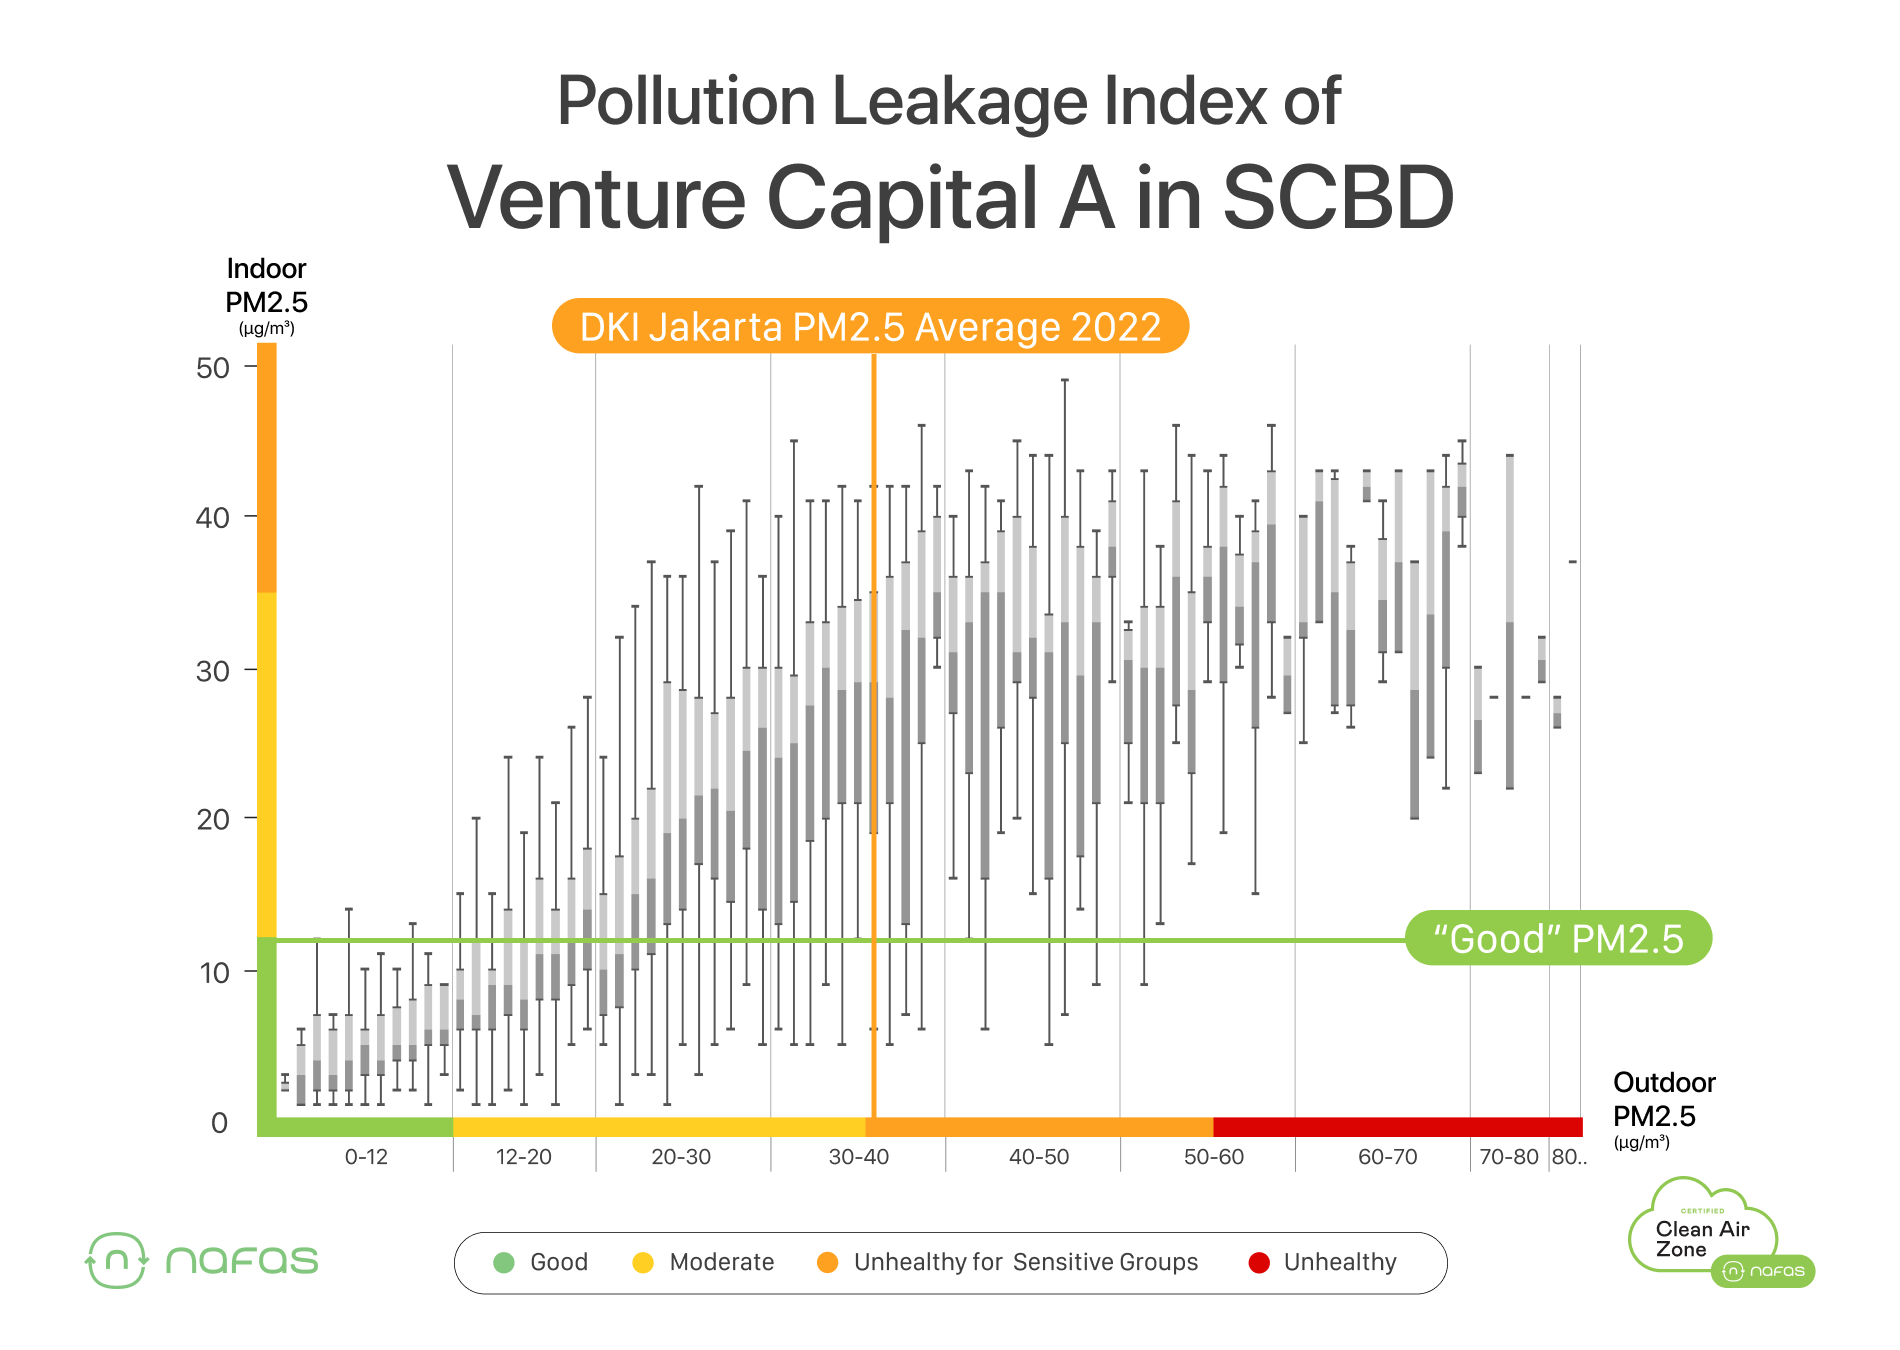
You can see that when outdoor PM2.5 levels go higher than 20 µg/m3, the current central air system can no longer keep the indoor air quality healthy.
And that’s crazy. Because Jakarta’s yearly average is 36 µg/m3, and July’s average was 58 µg/m3.
So what does an Unhealthy office look like? Let’s take a look at the data!
What Does An Unhealthy Office Look Like?
Now that you know why and how air pollution gets into offices, we can go a little bit deeper into the data from a variety of different locations around Jakarta.
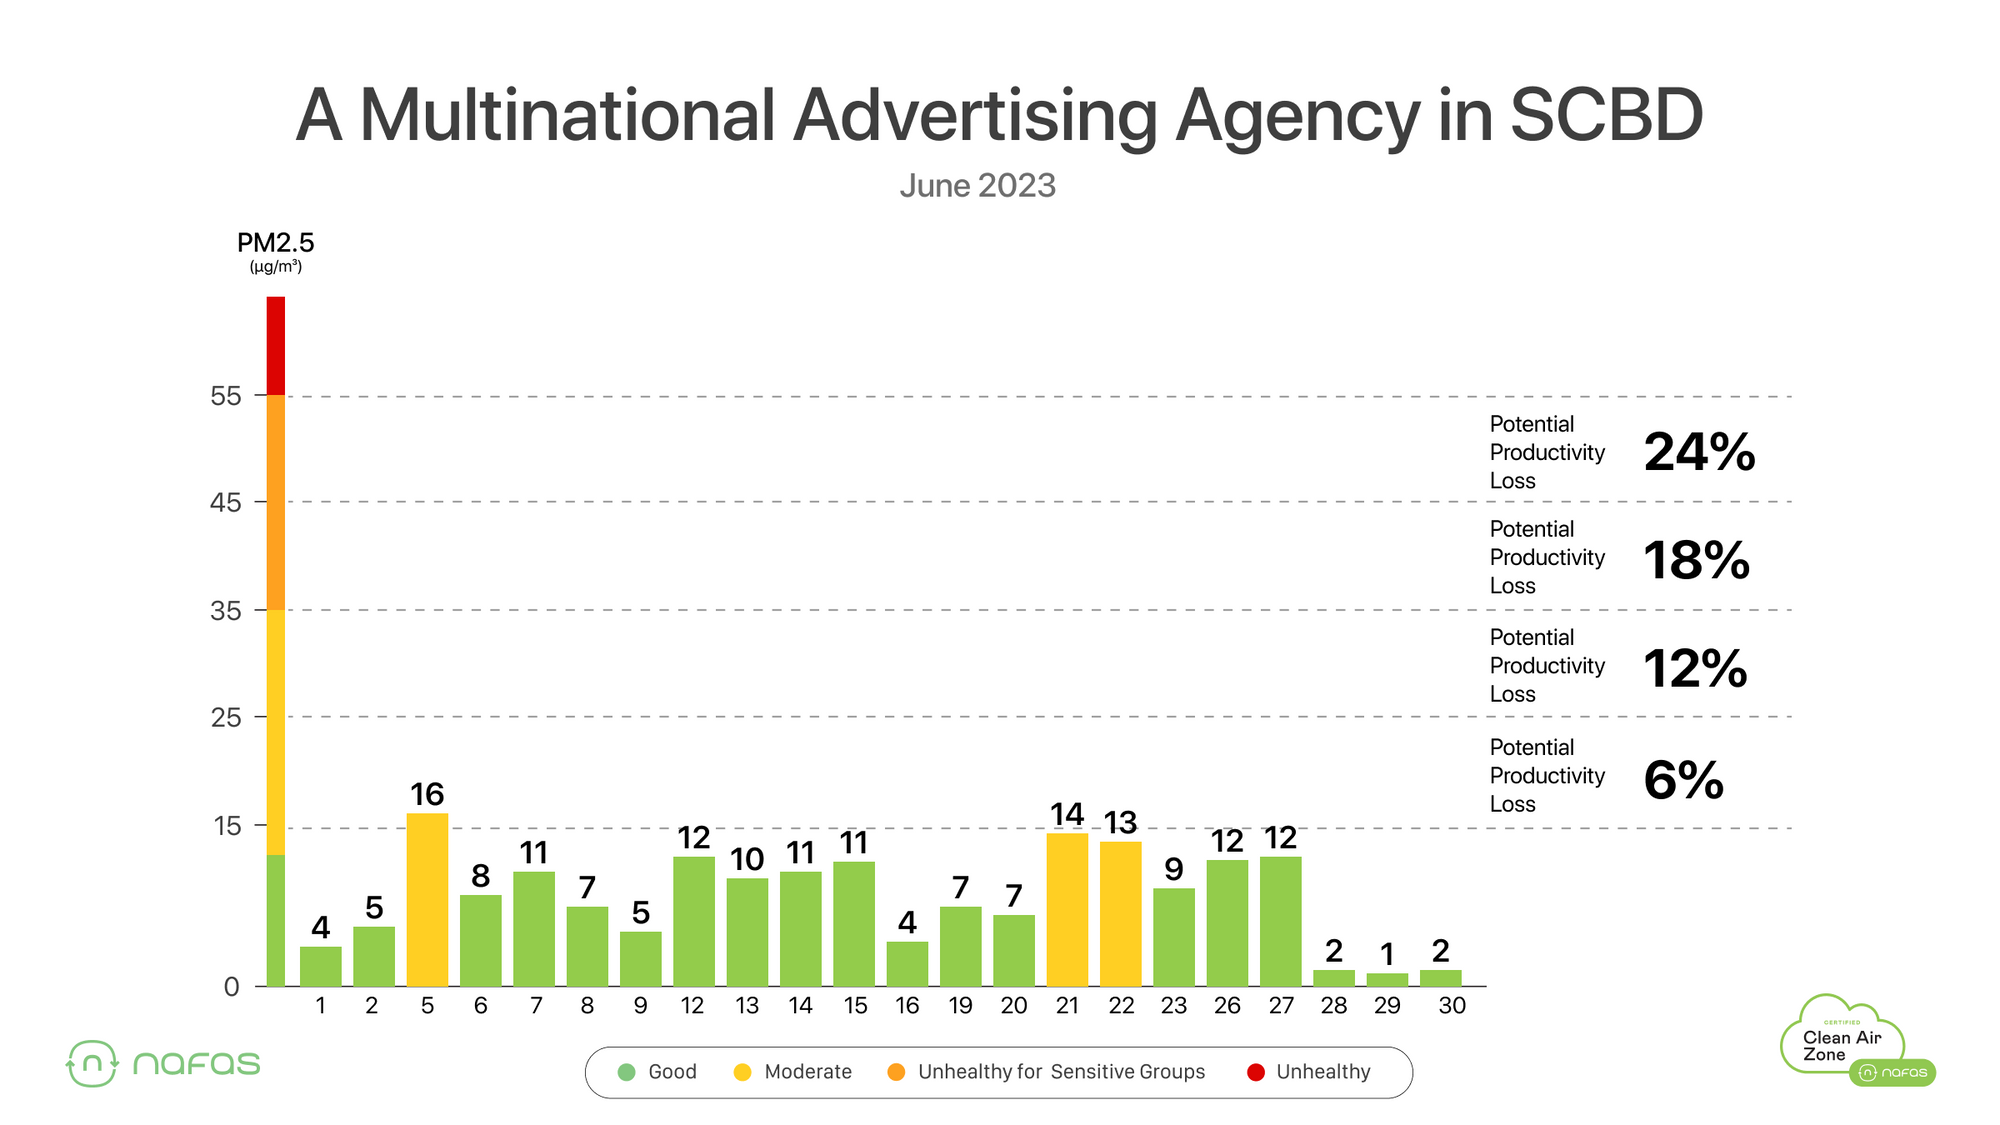
First, an office in Kuningan - the home of a multinational advertising agency. Air pollution in July 2023 was super high in Jakarta, and it was also super high right inside the office. The building was completed in 2020, so it’s only 3 years old.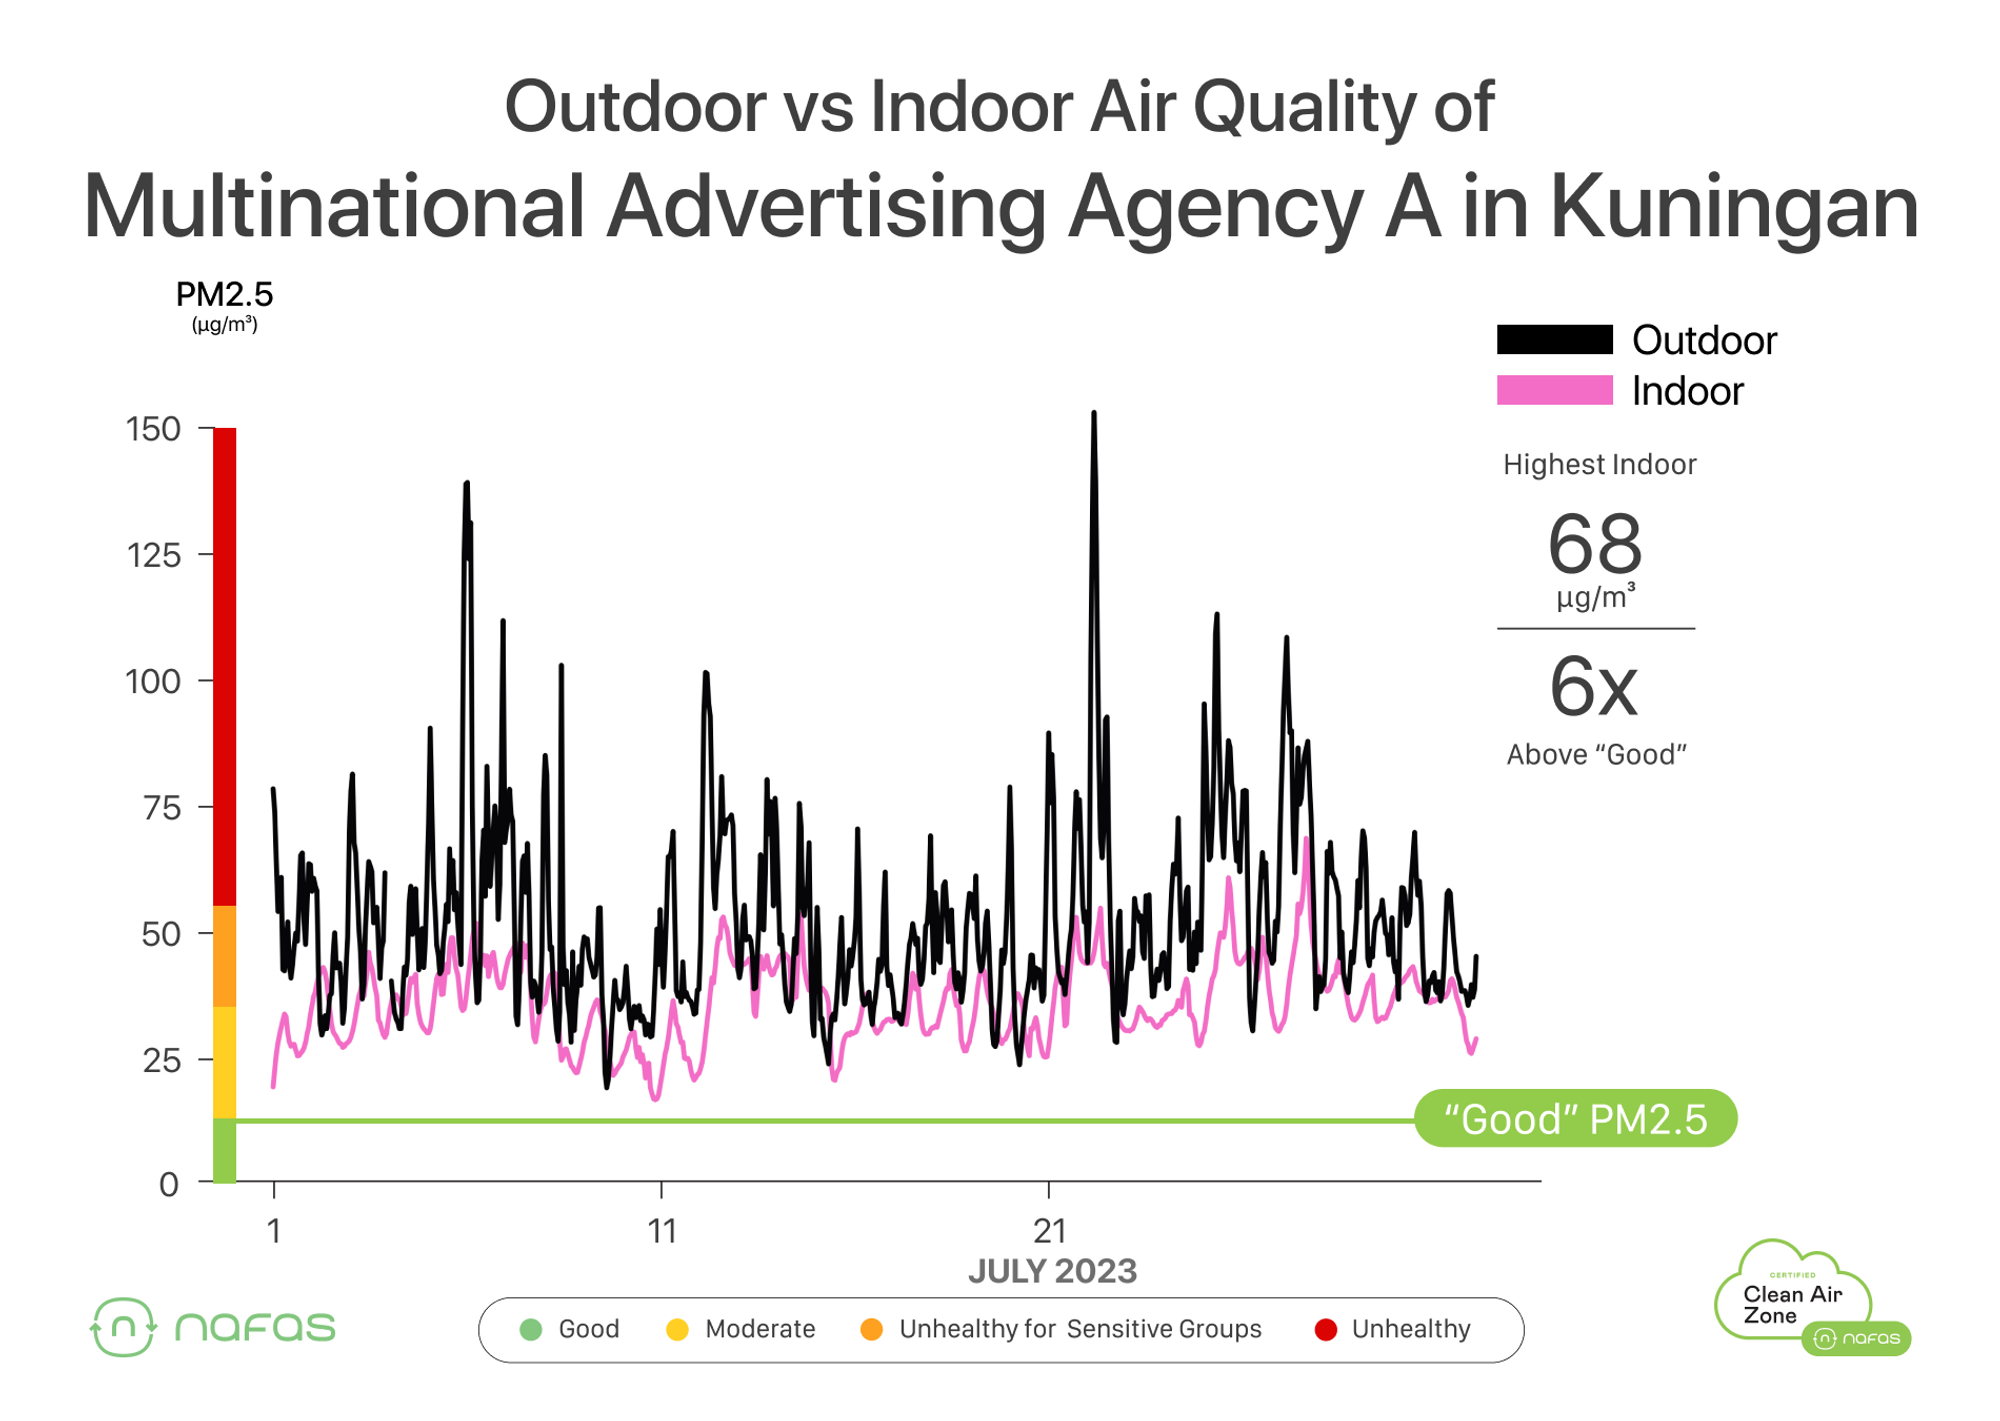
The peak inside this office during work hours: 68 µg/m3 (6x above “Good”)
Next, an office in a different part of Kuningan - the home of a startup. In July 2023, we can see that the penetration of outdoor pollution indoors was extremely high. This building is over 25 years old.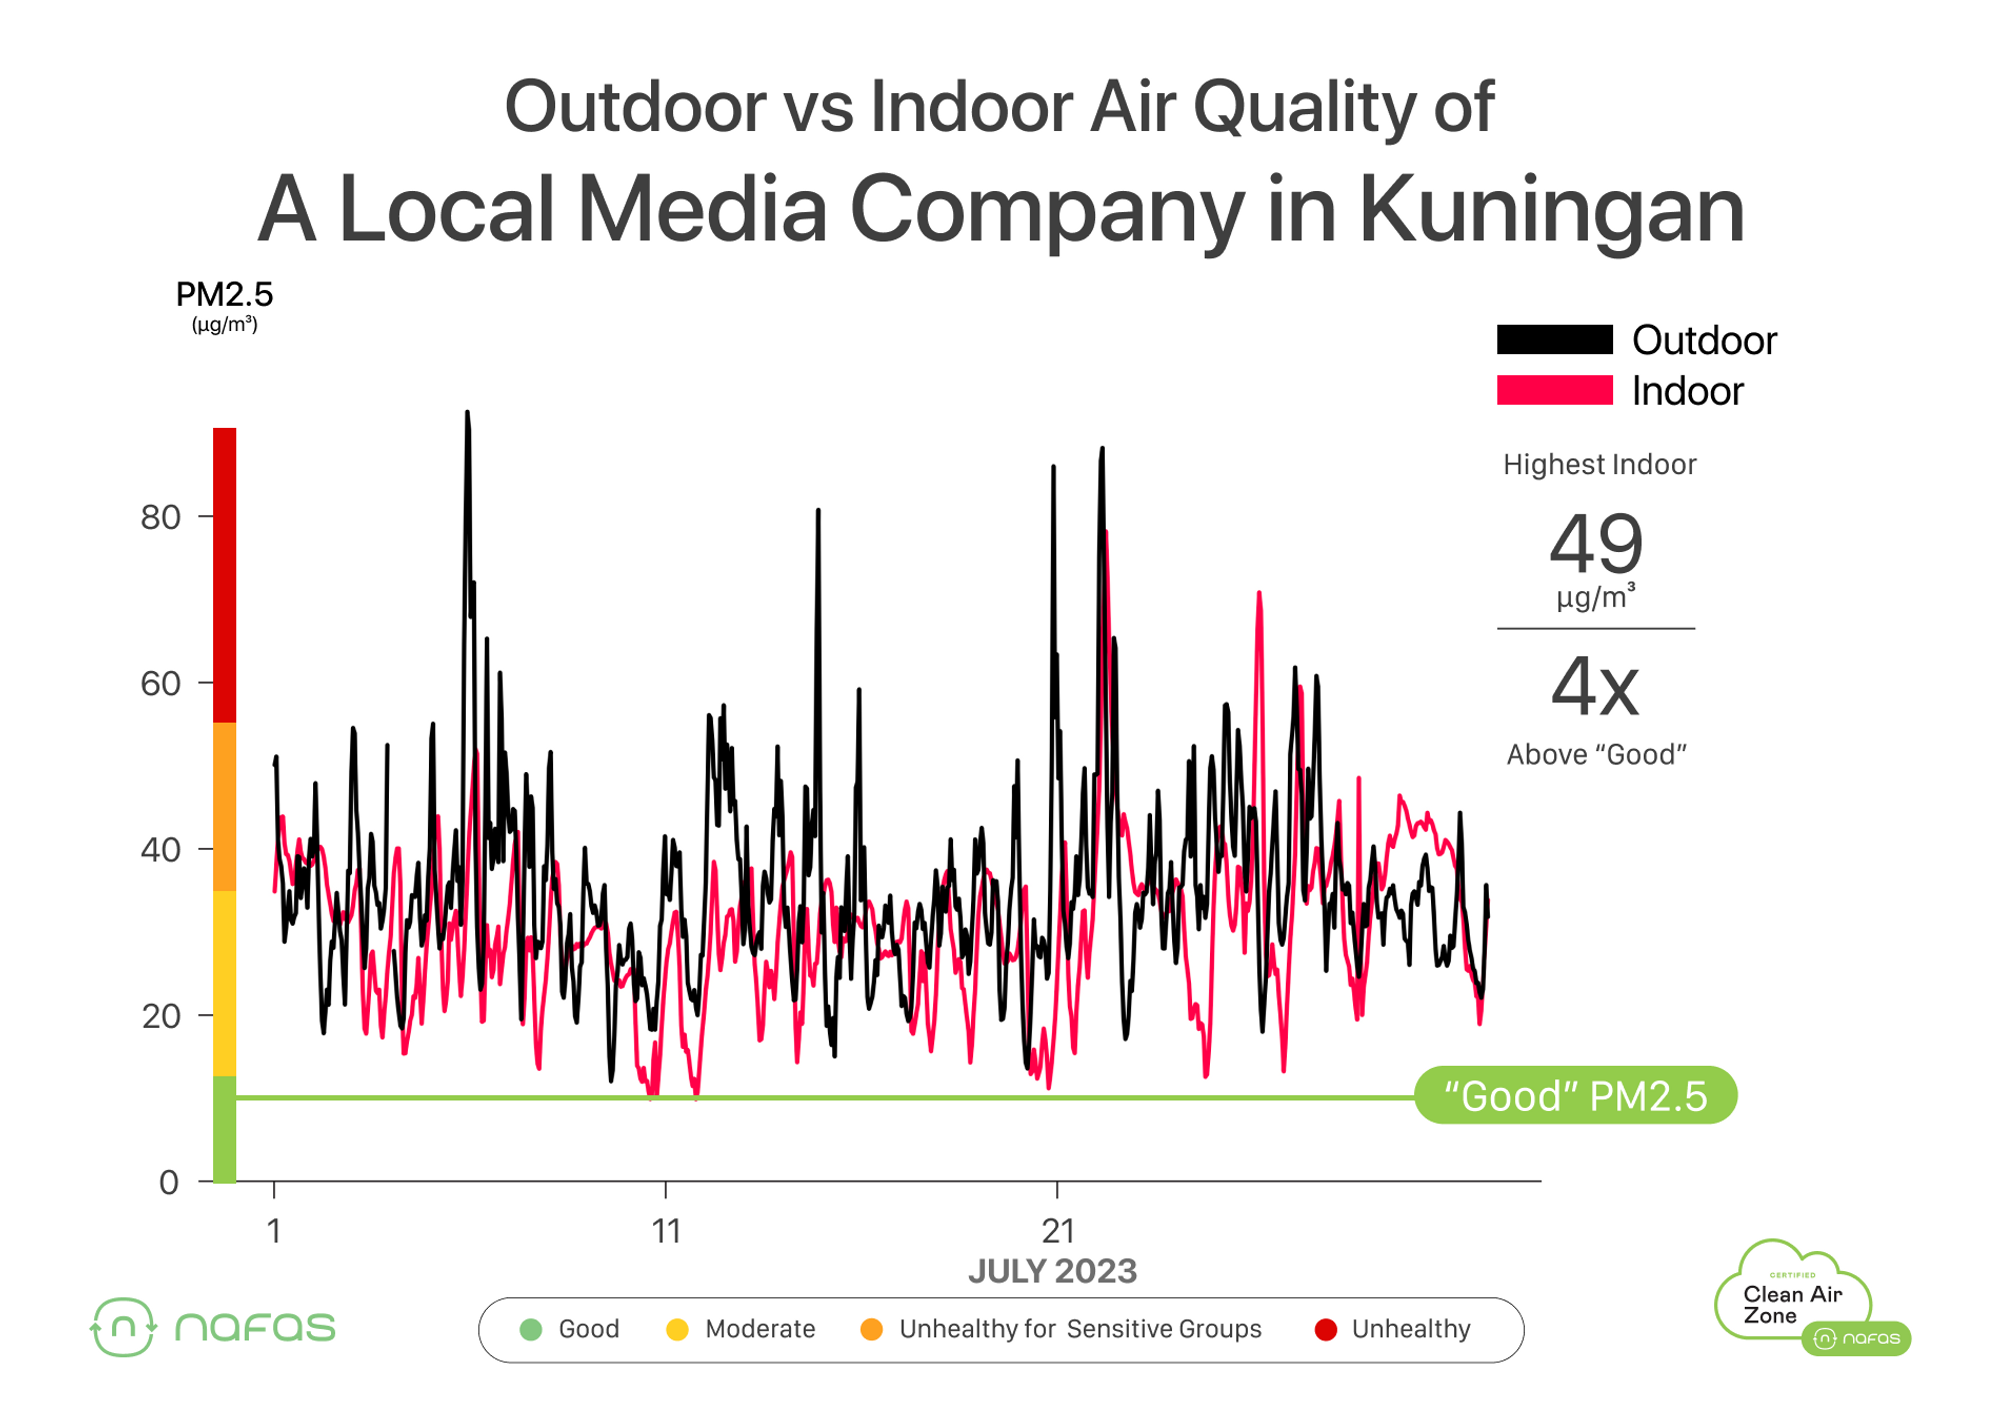
The peak inside this office during work hours: 49 µg/m3 (4x above “Good”)
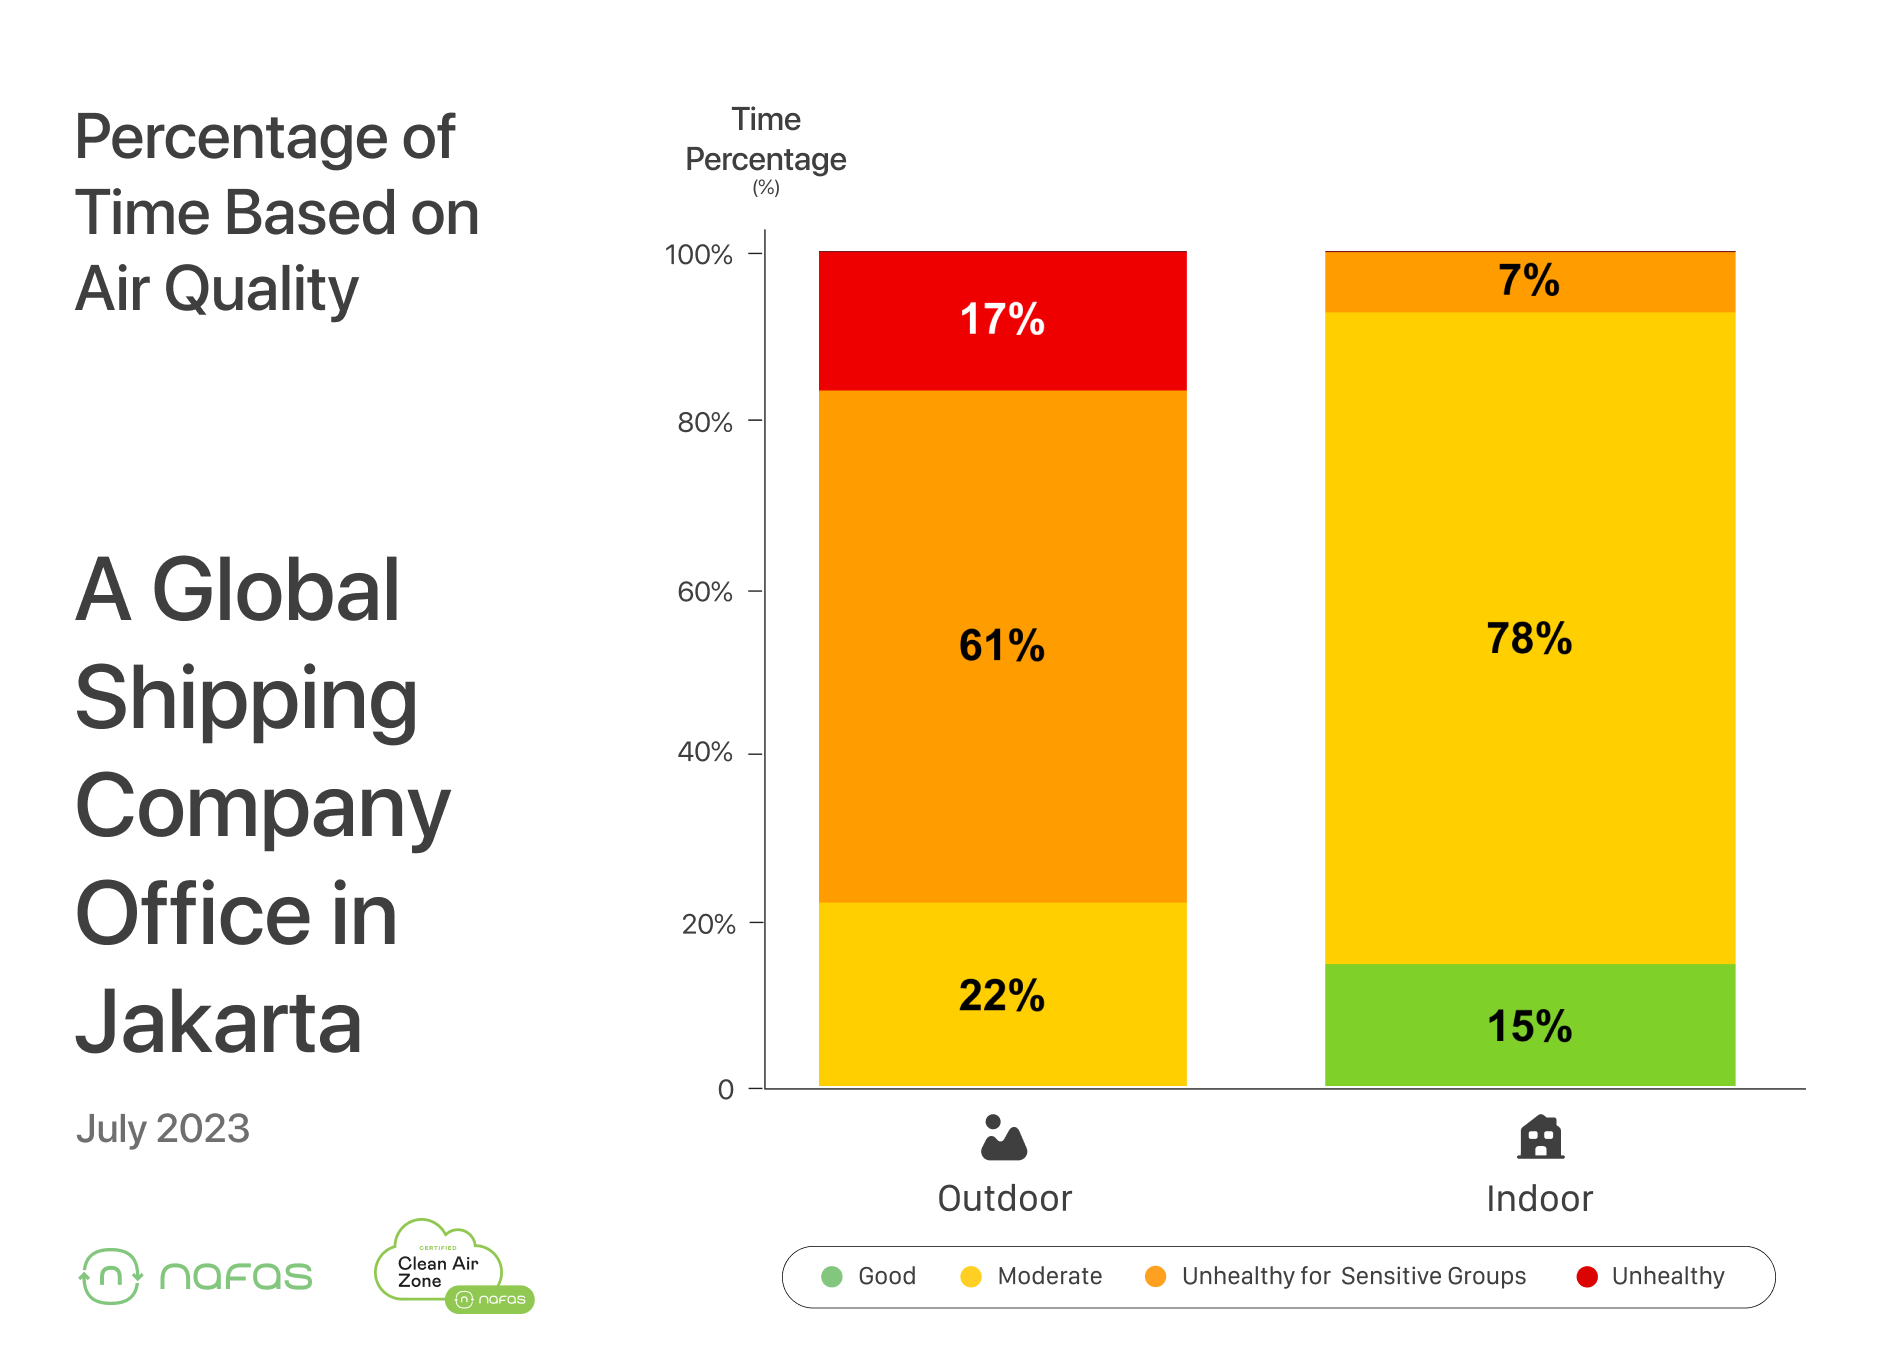
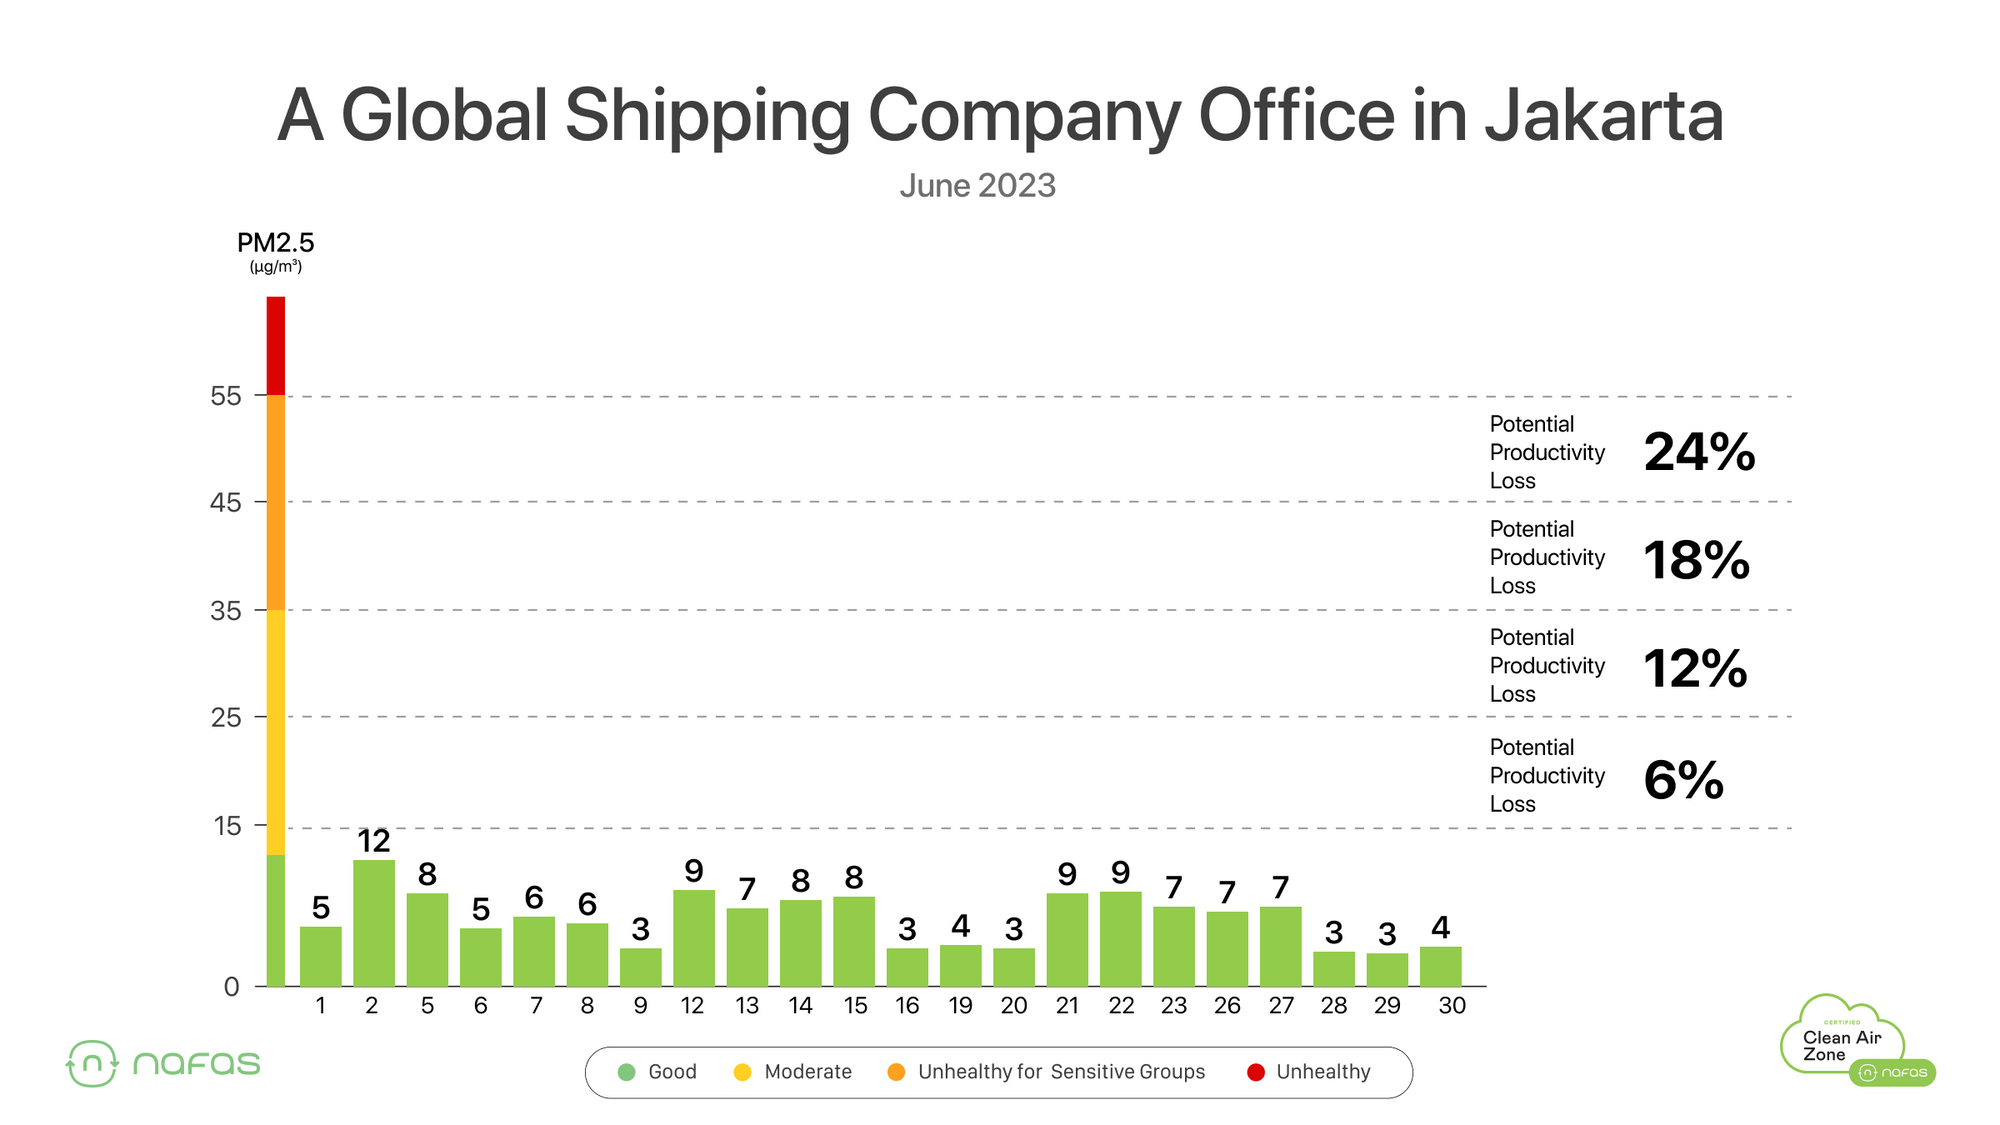
Let’s move to Sudirman, and take a look at an office of a multinational shipping company. This is data from June 2023 - the same problem is happening. Also completed in 2020, this building is considered to be new.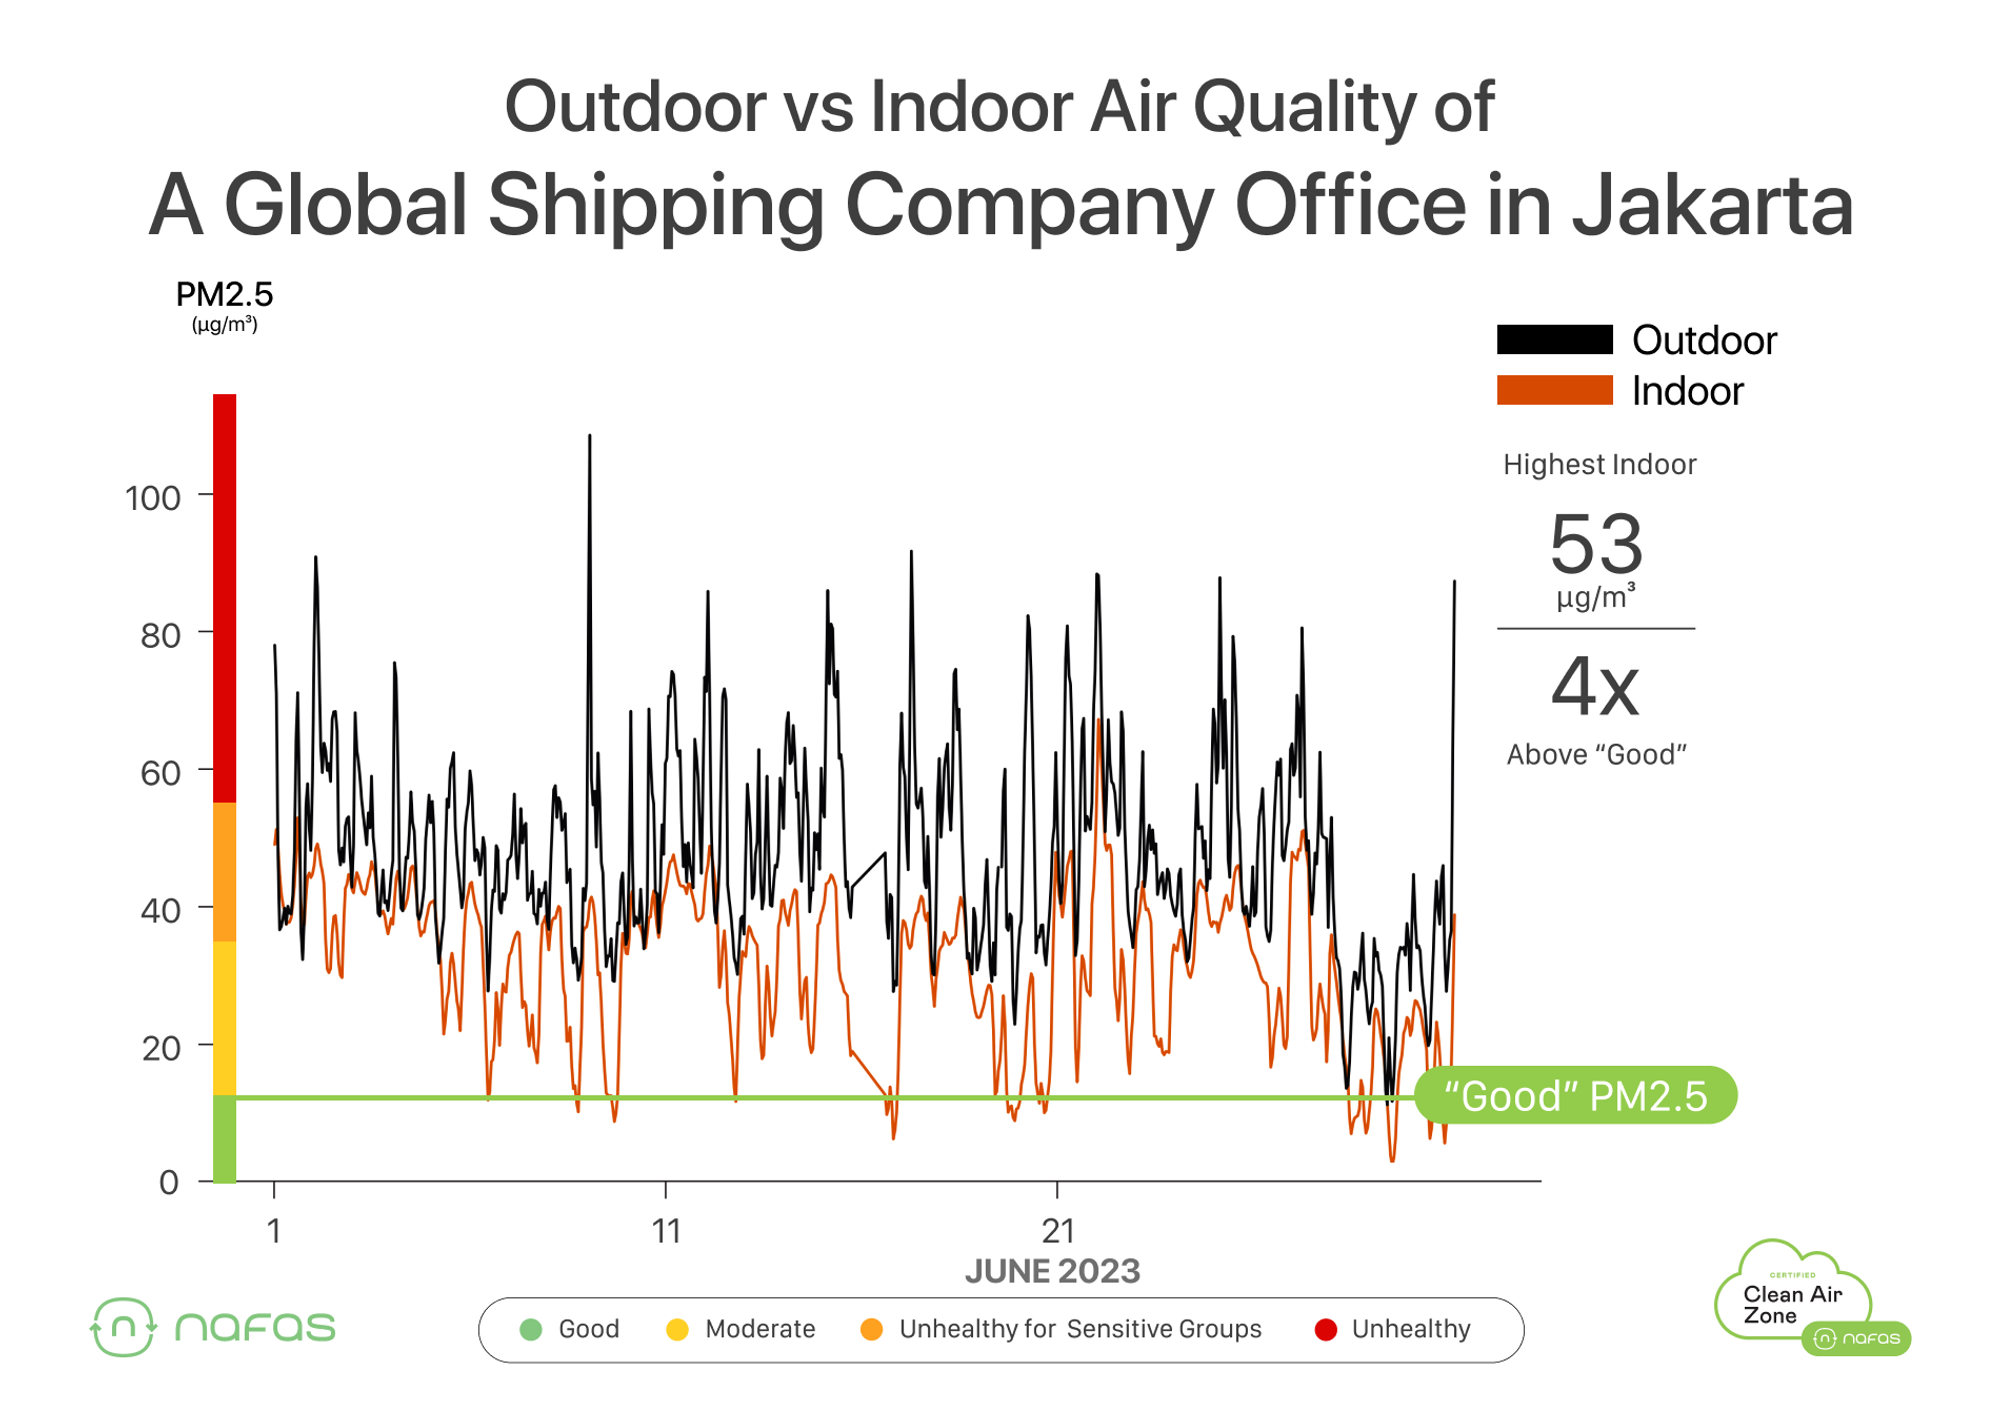
The peak inside this office during work hours: 53 µg/m3 (4x above “Good”).
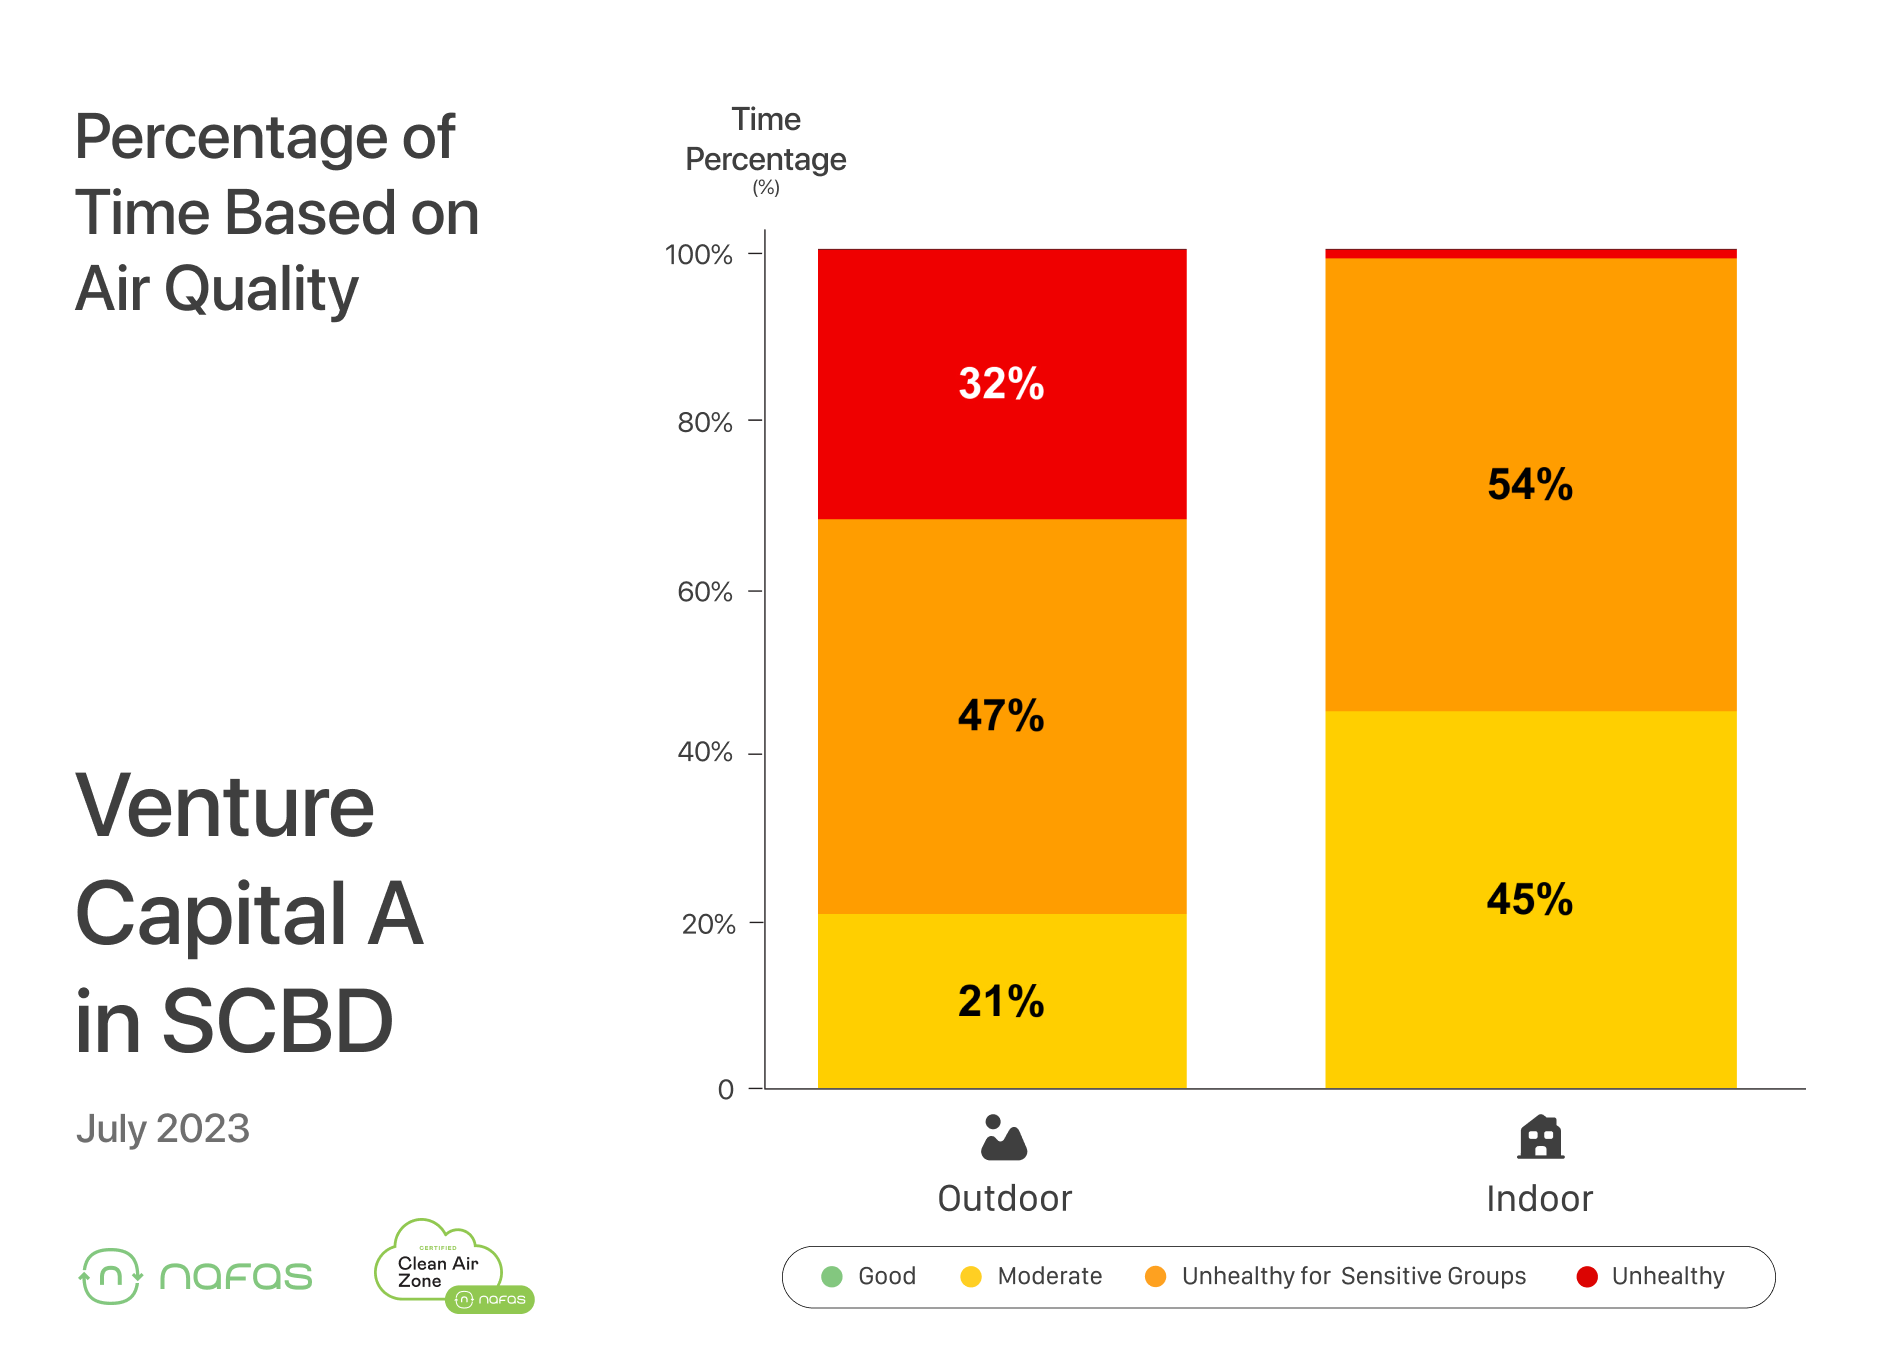
Finally, SCBD or the new Silicon Valley with a Venture Capital office. You can see that in July 2023 the indoor air quality inside the office was quite terrible - which is interesting because the building is less than 8 years old.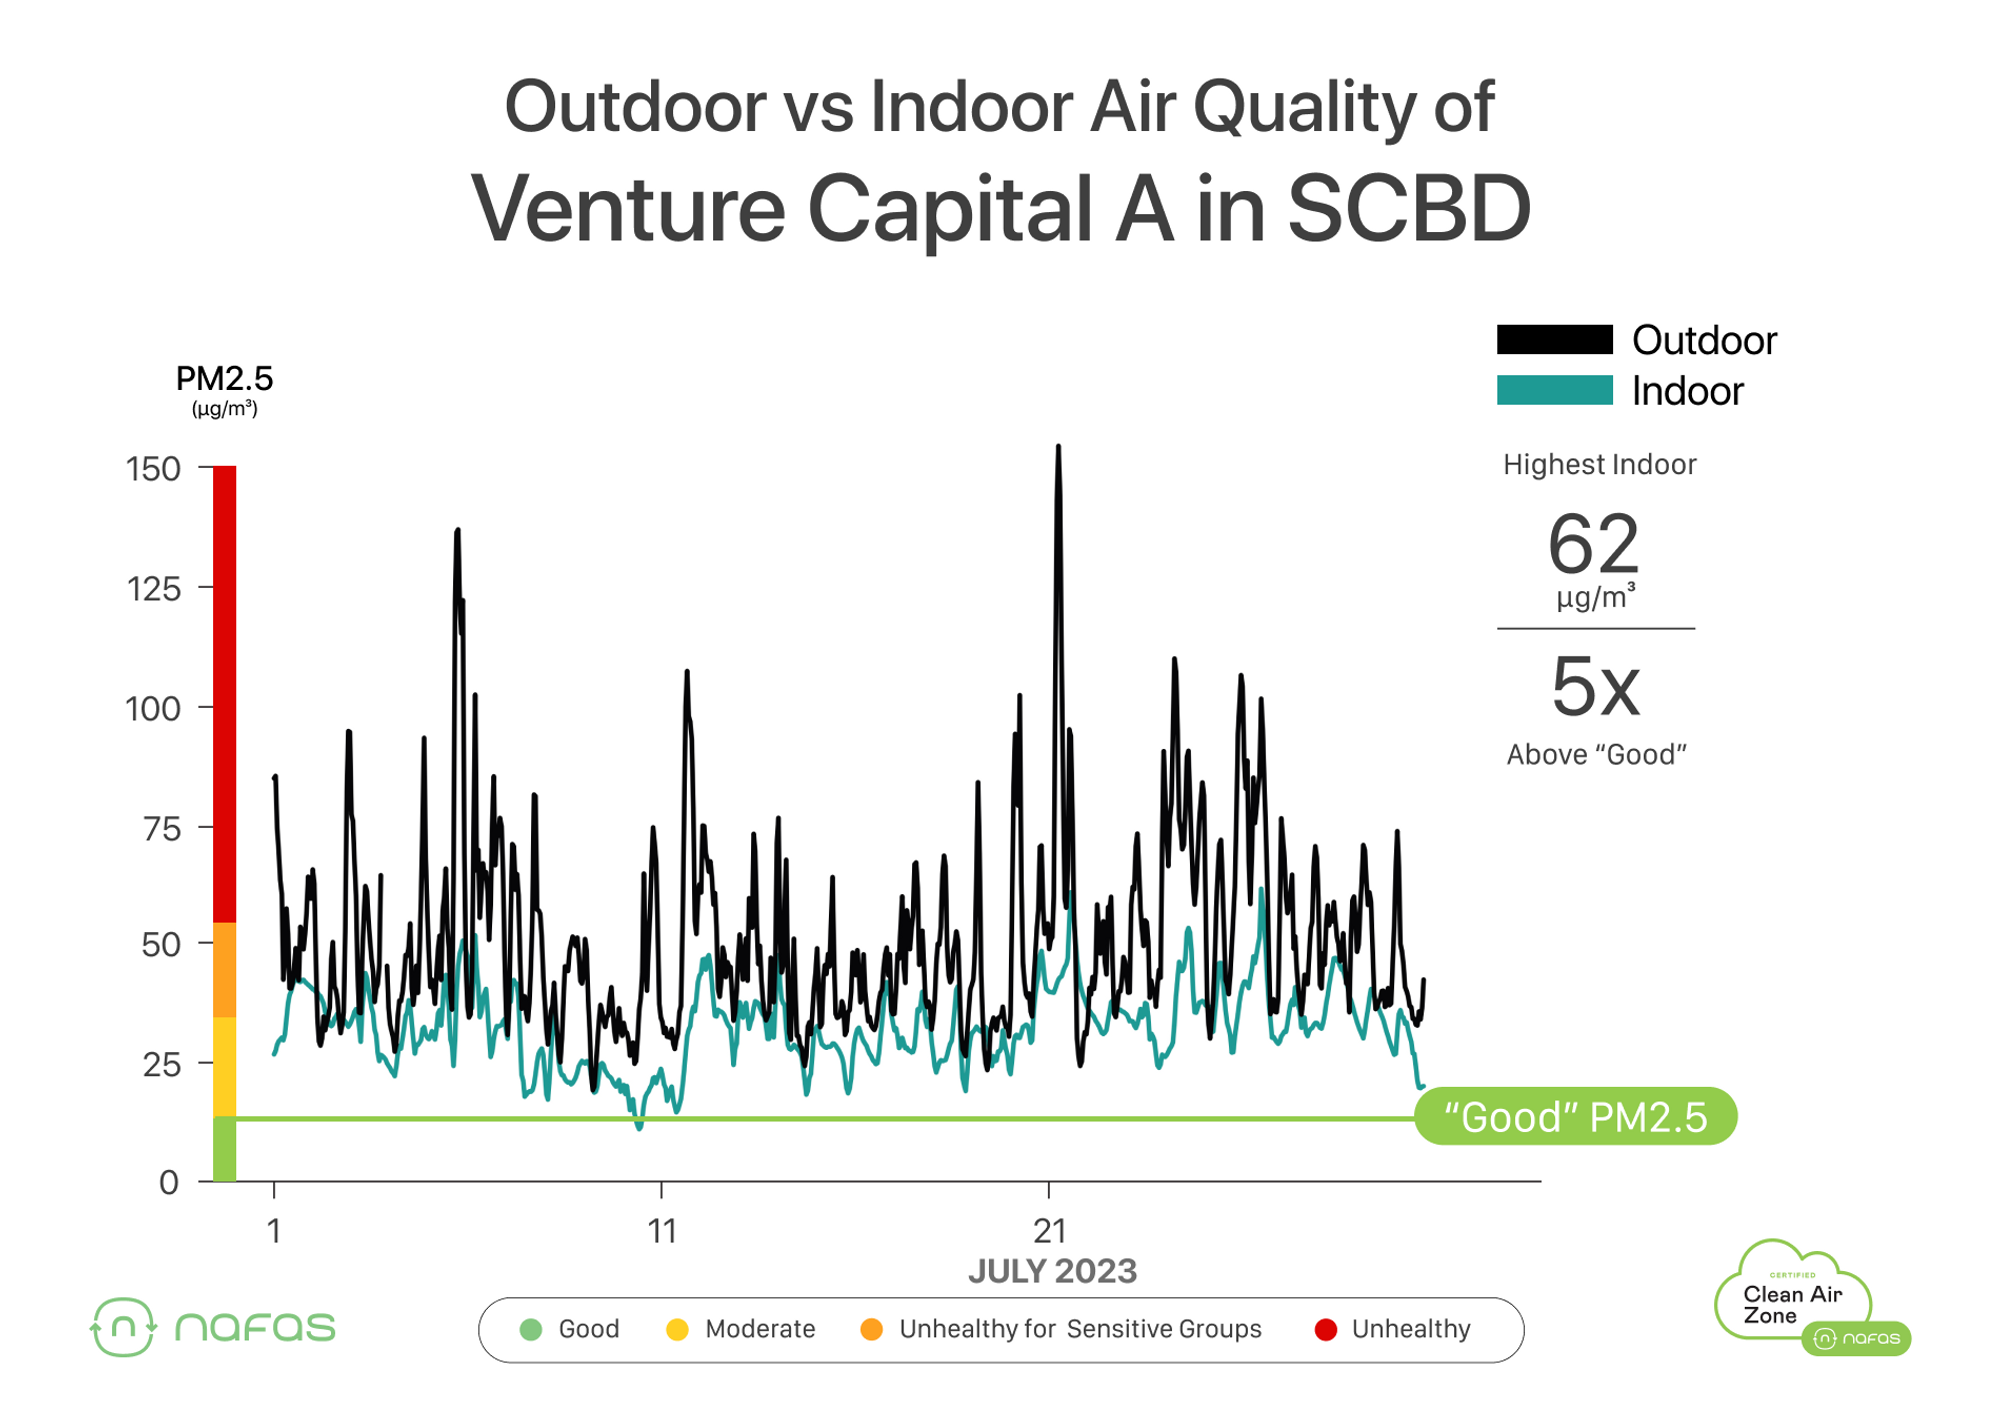
The peak inside this office during work hours: 62 ug/m3 (5x above “Good”)
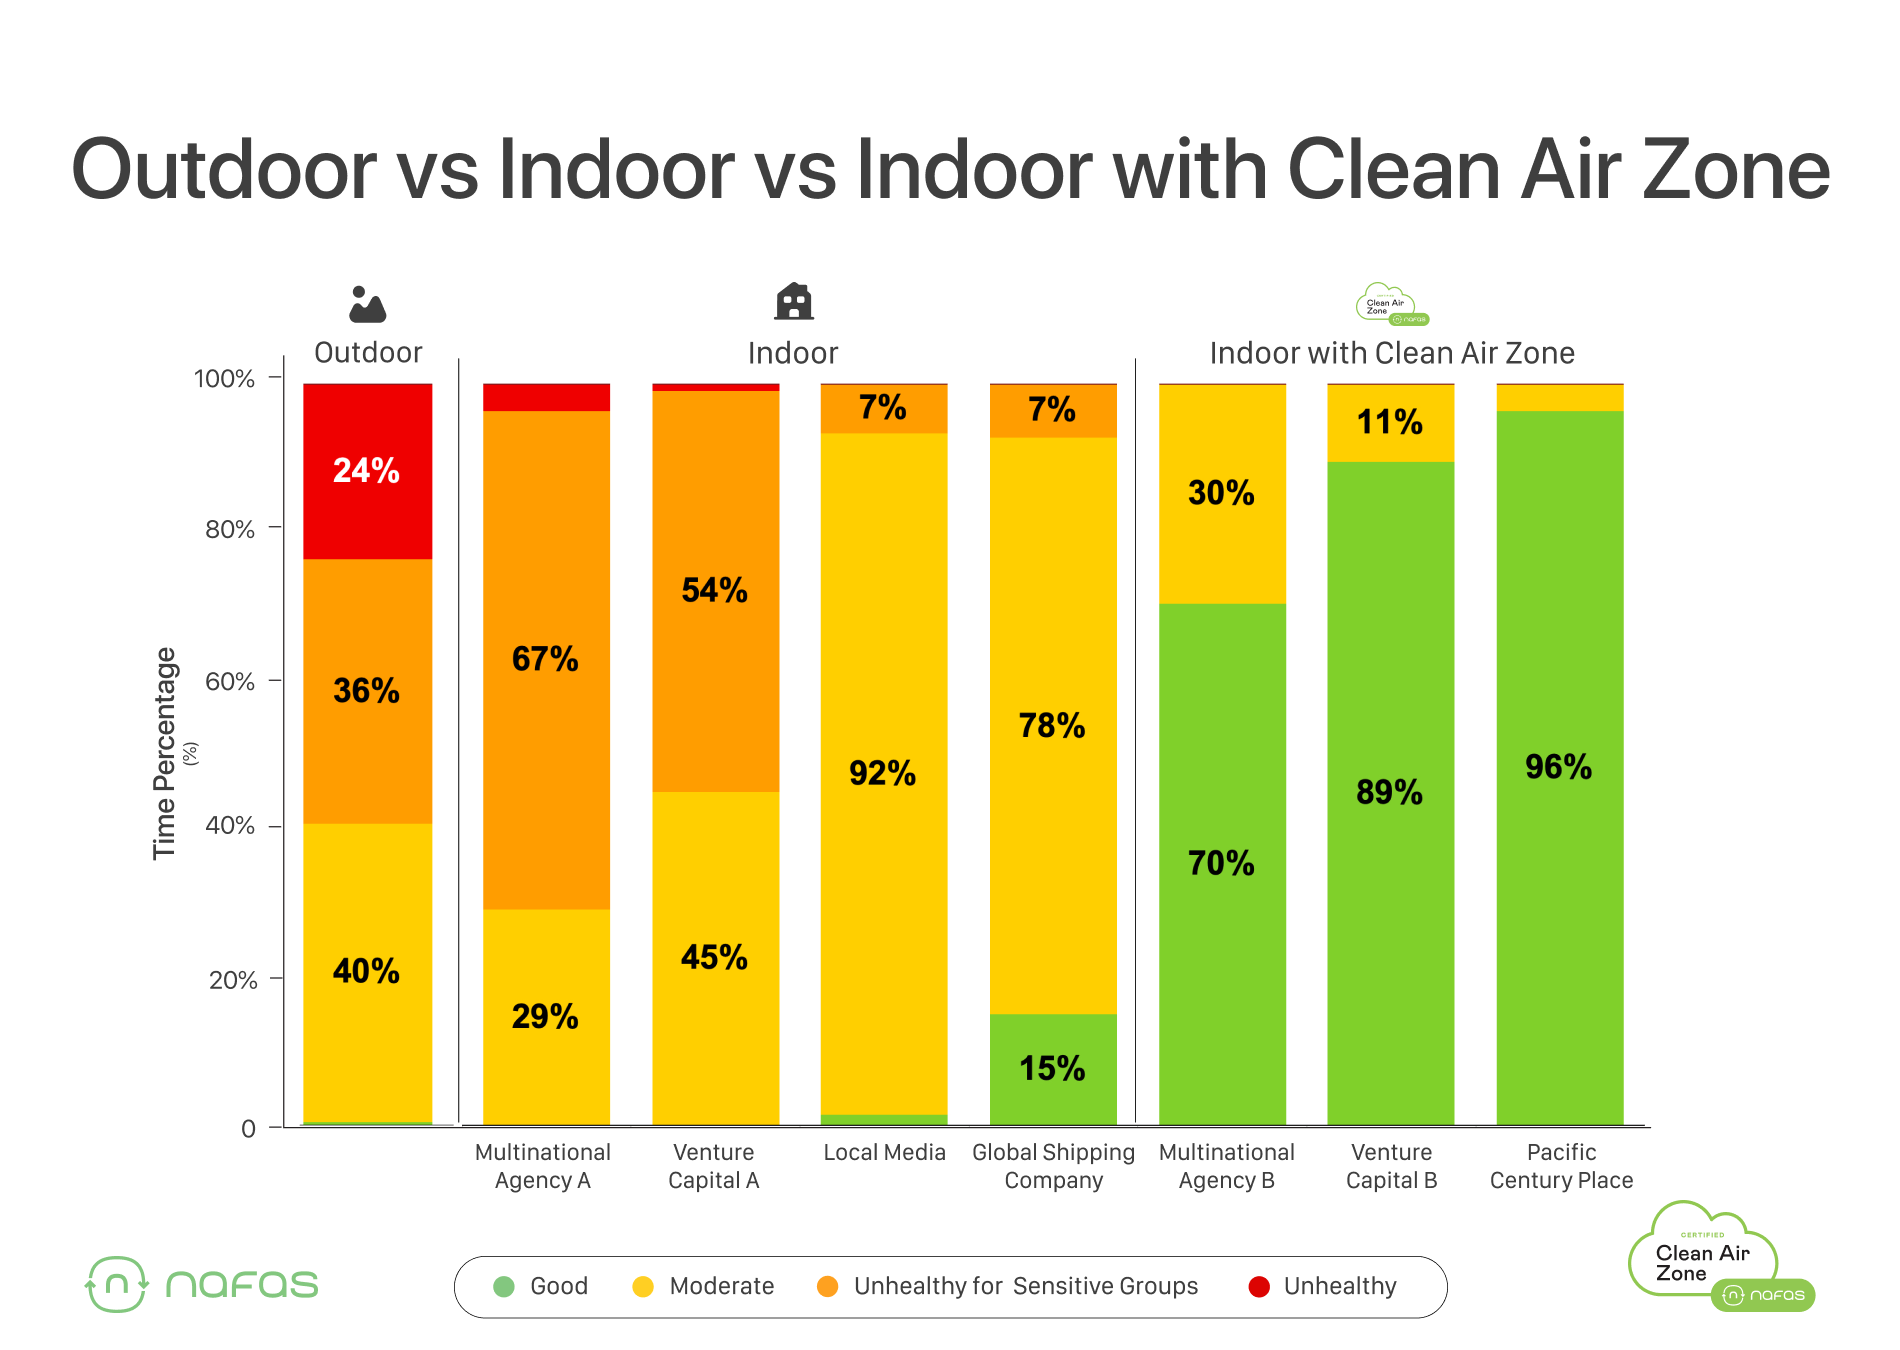
When comparing the total number of hours of air pollution during workdays (8-5pm, weekdays only) and compare outdoor to indoor, you can see that there really isn’t too big of a difference.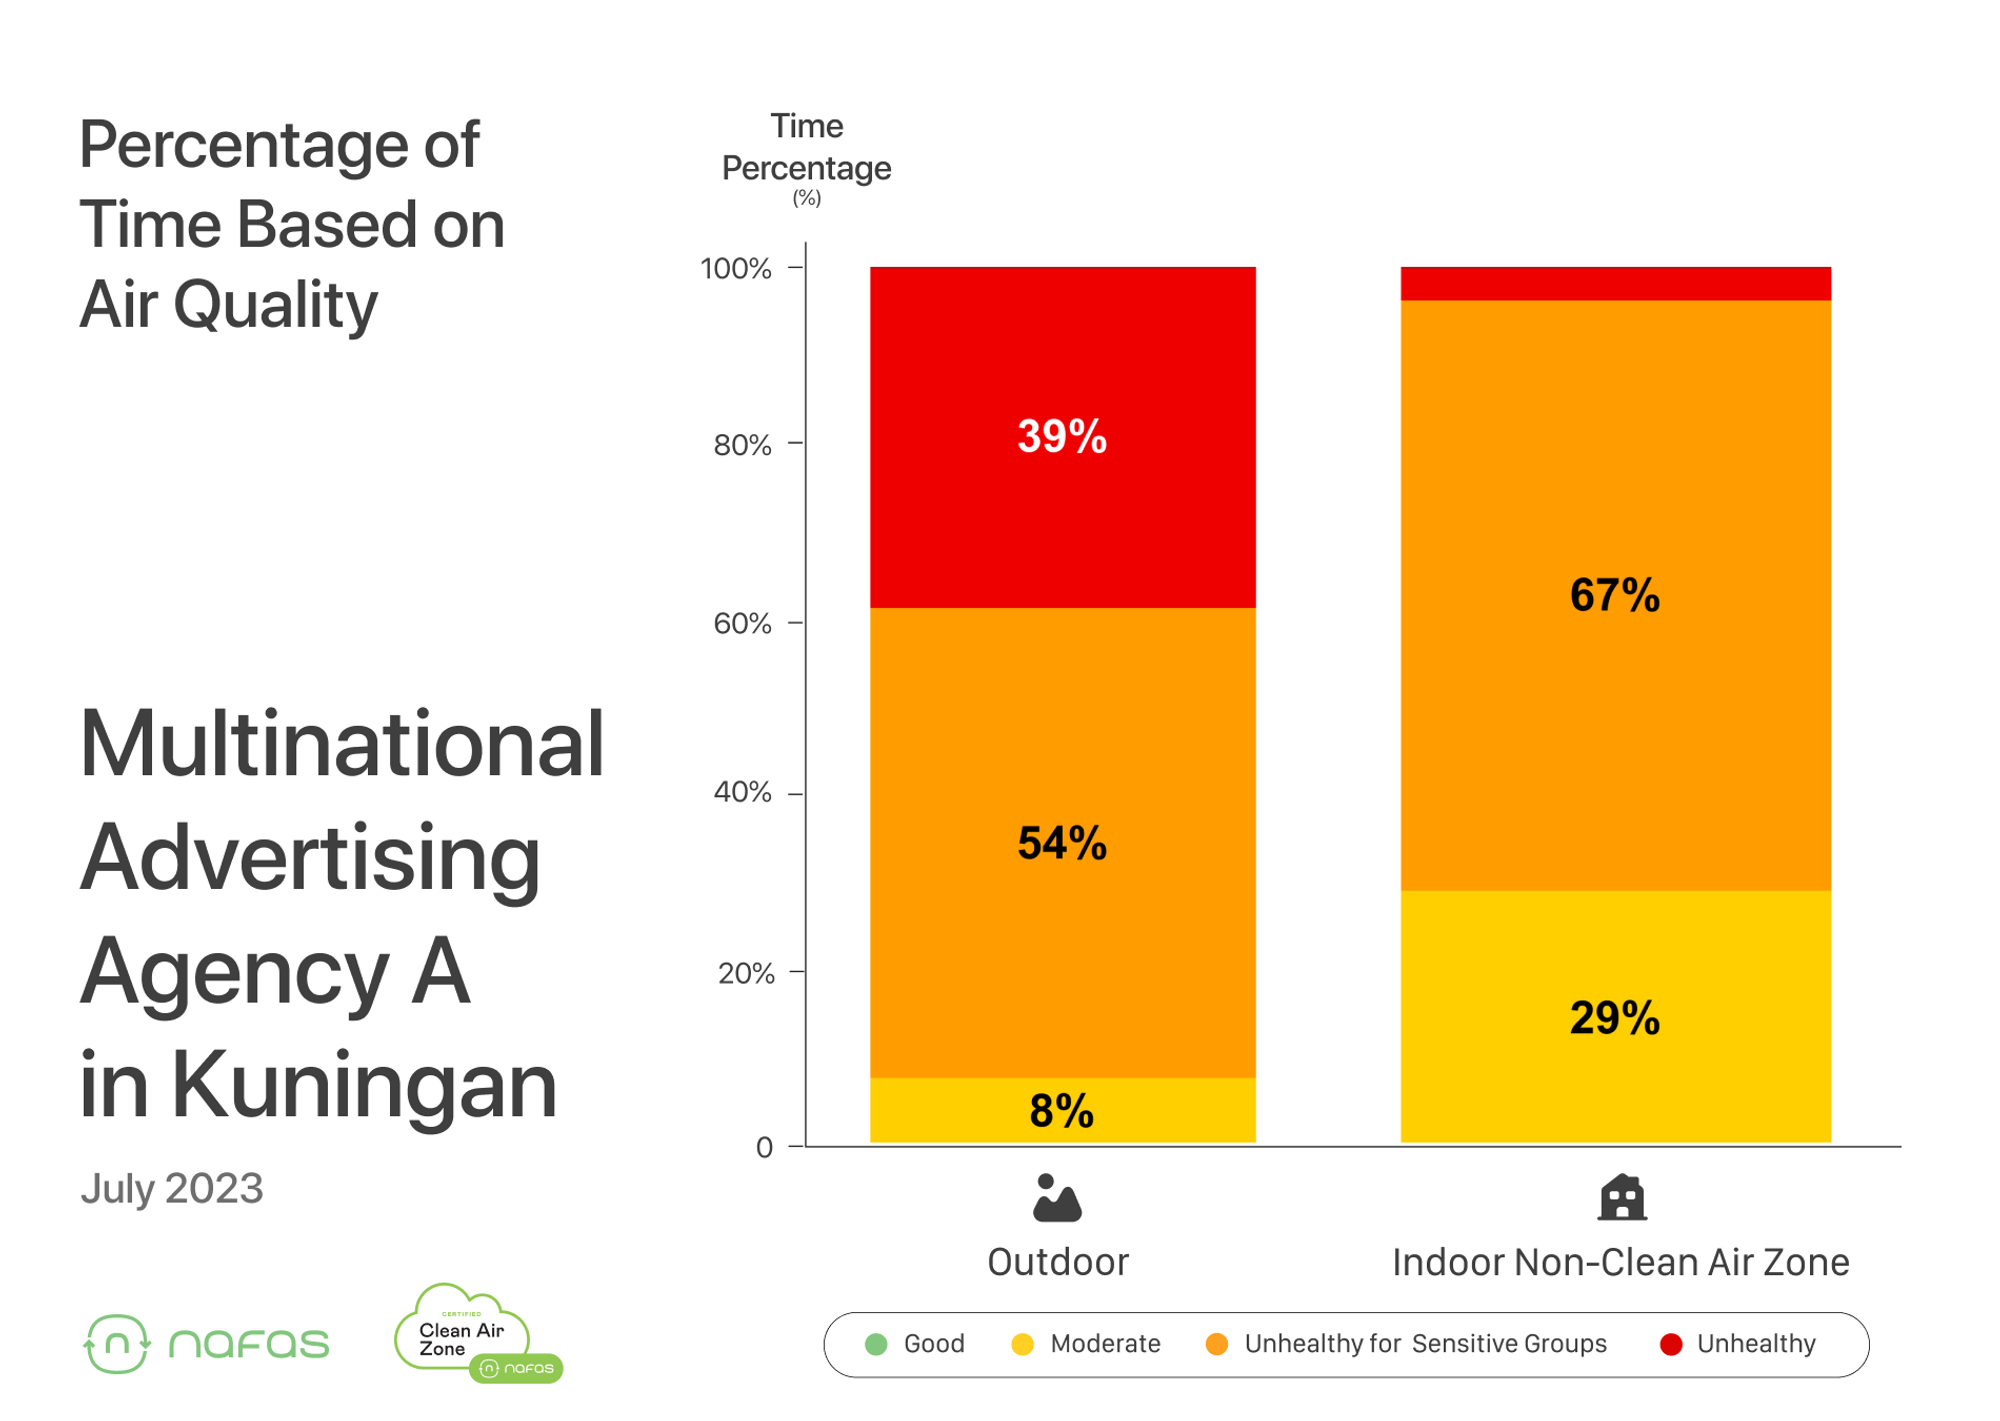
The facts are clear - outdoor pollution is getting inside.
Kuningan, Sudirman, SCBD - this is a problem for all of us, everywhere.
So why should we care?
What Does This Mean For Performance And Productivity?
In the previous post titled “How Pollution Impacts Performance At The Office”, we dove into key facts about the impact of air pollution in the office on cognitive performance.
We highlighted two key studies which focused on the impact of air pollution on human performance.
1) Harvard COGFX Study - Office employees performed worse on 4 out of 5 cognitive tests when indoor PM2.5 levels were above 12 µg/m3. Here’s what that looks like in the SCBD office.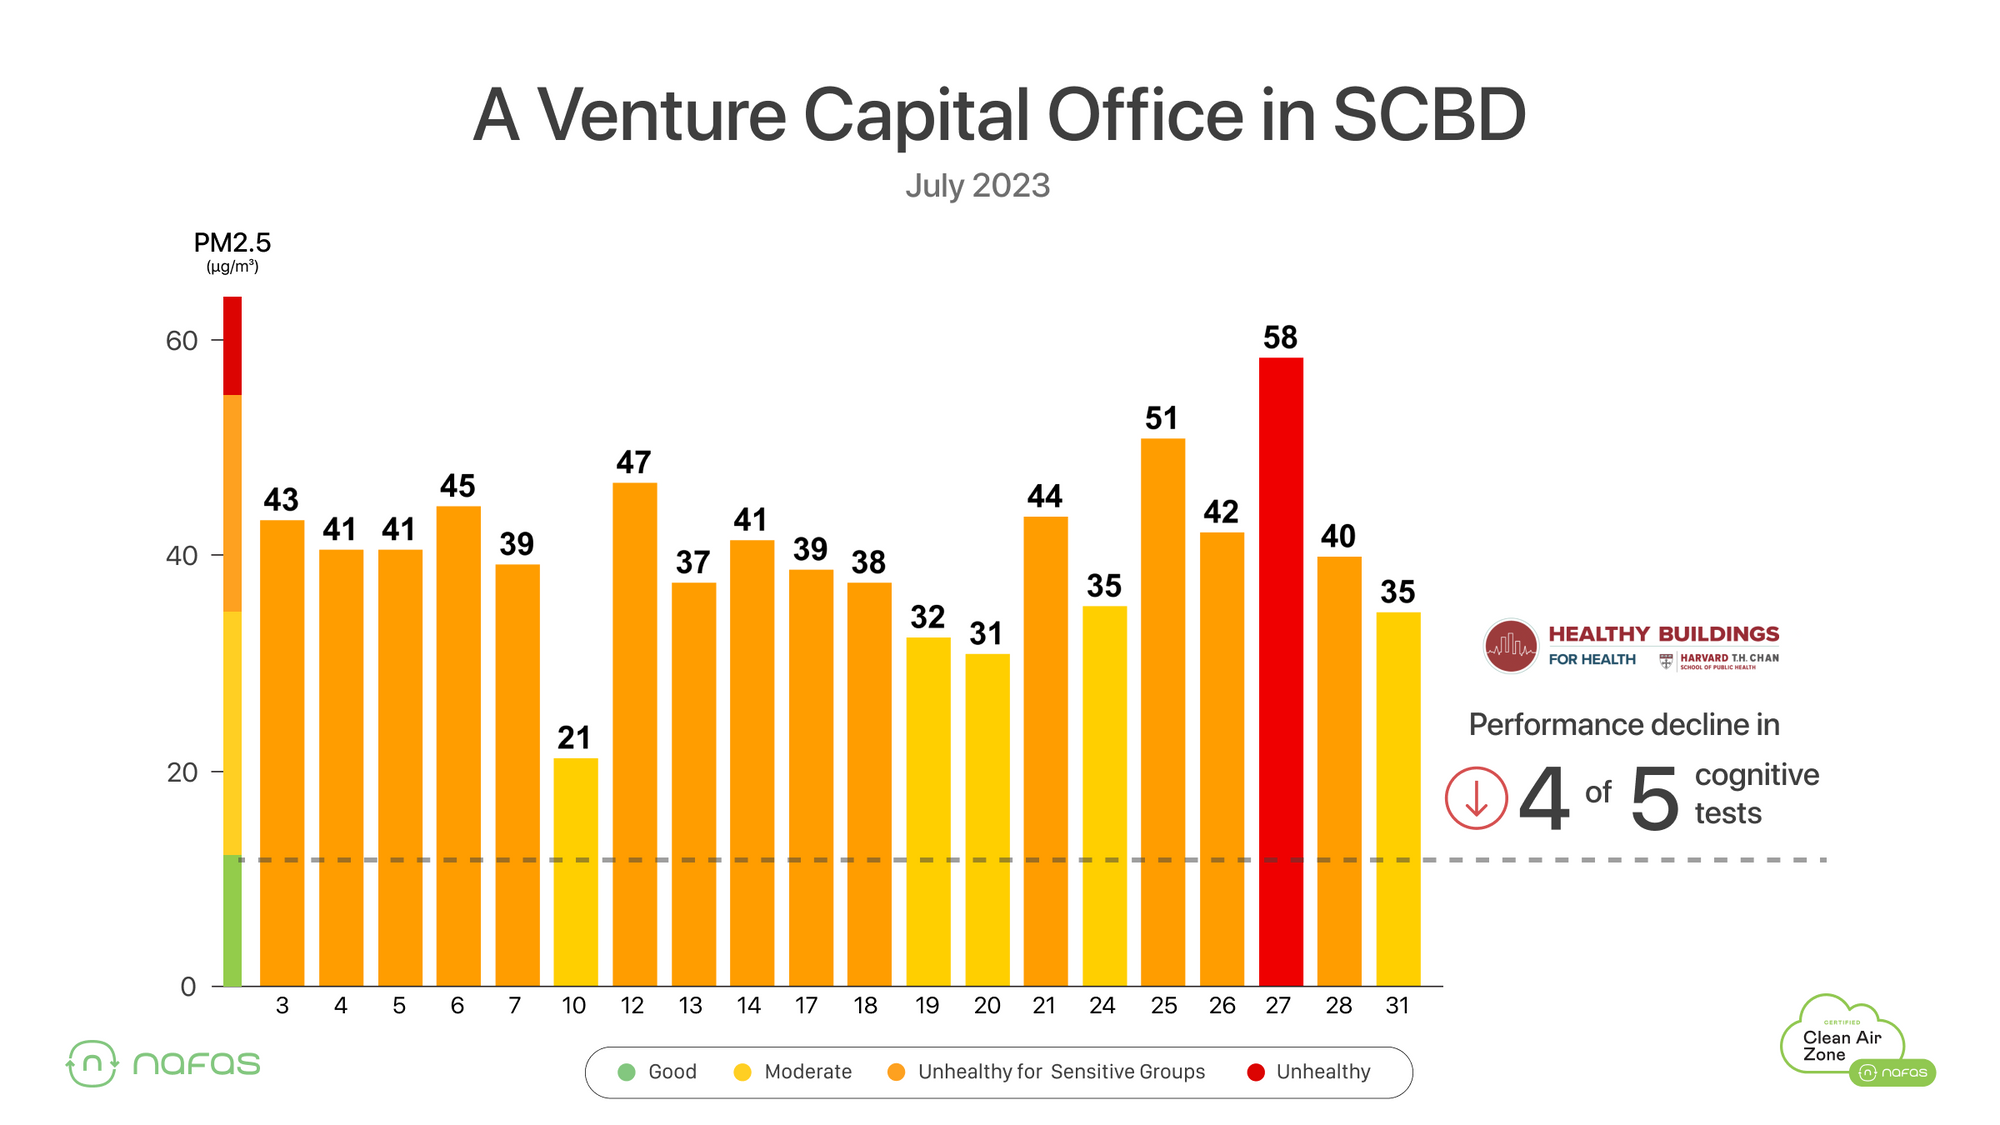
2) USC Productivity Study - For each 10 µg/m3 of PM2.5 above 15 µg/m3, productivity and performance were reduced by 6%. Here’s what that looks like in the Kuningan office at the multinational agency.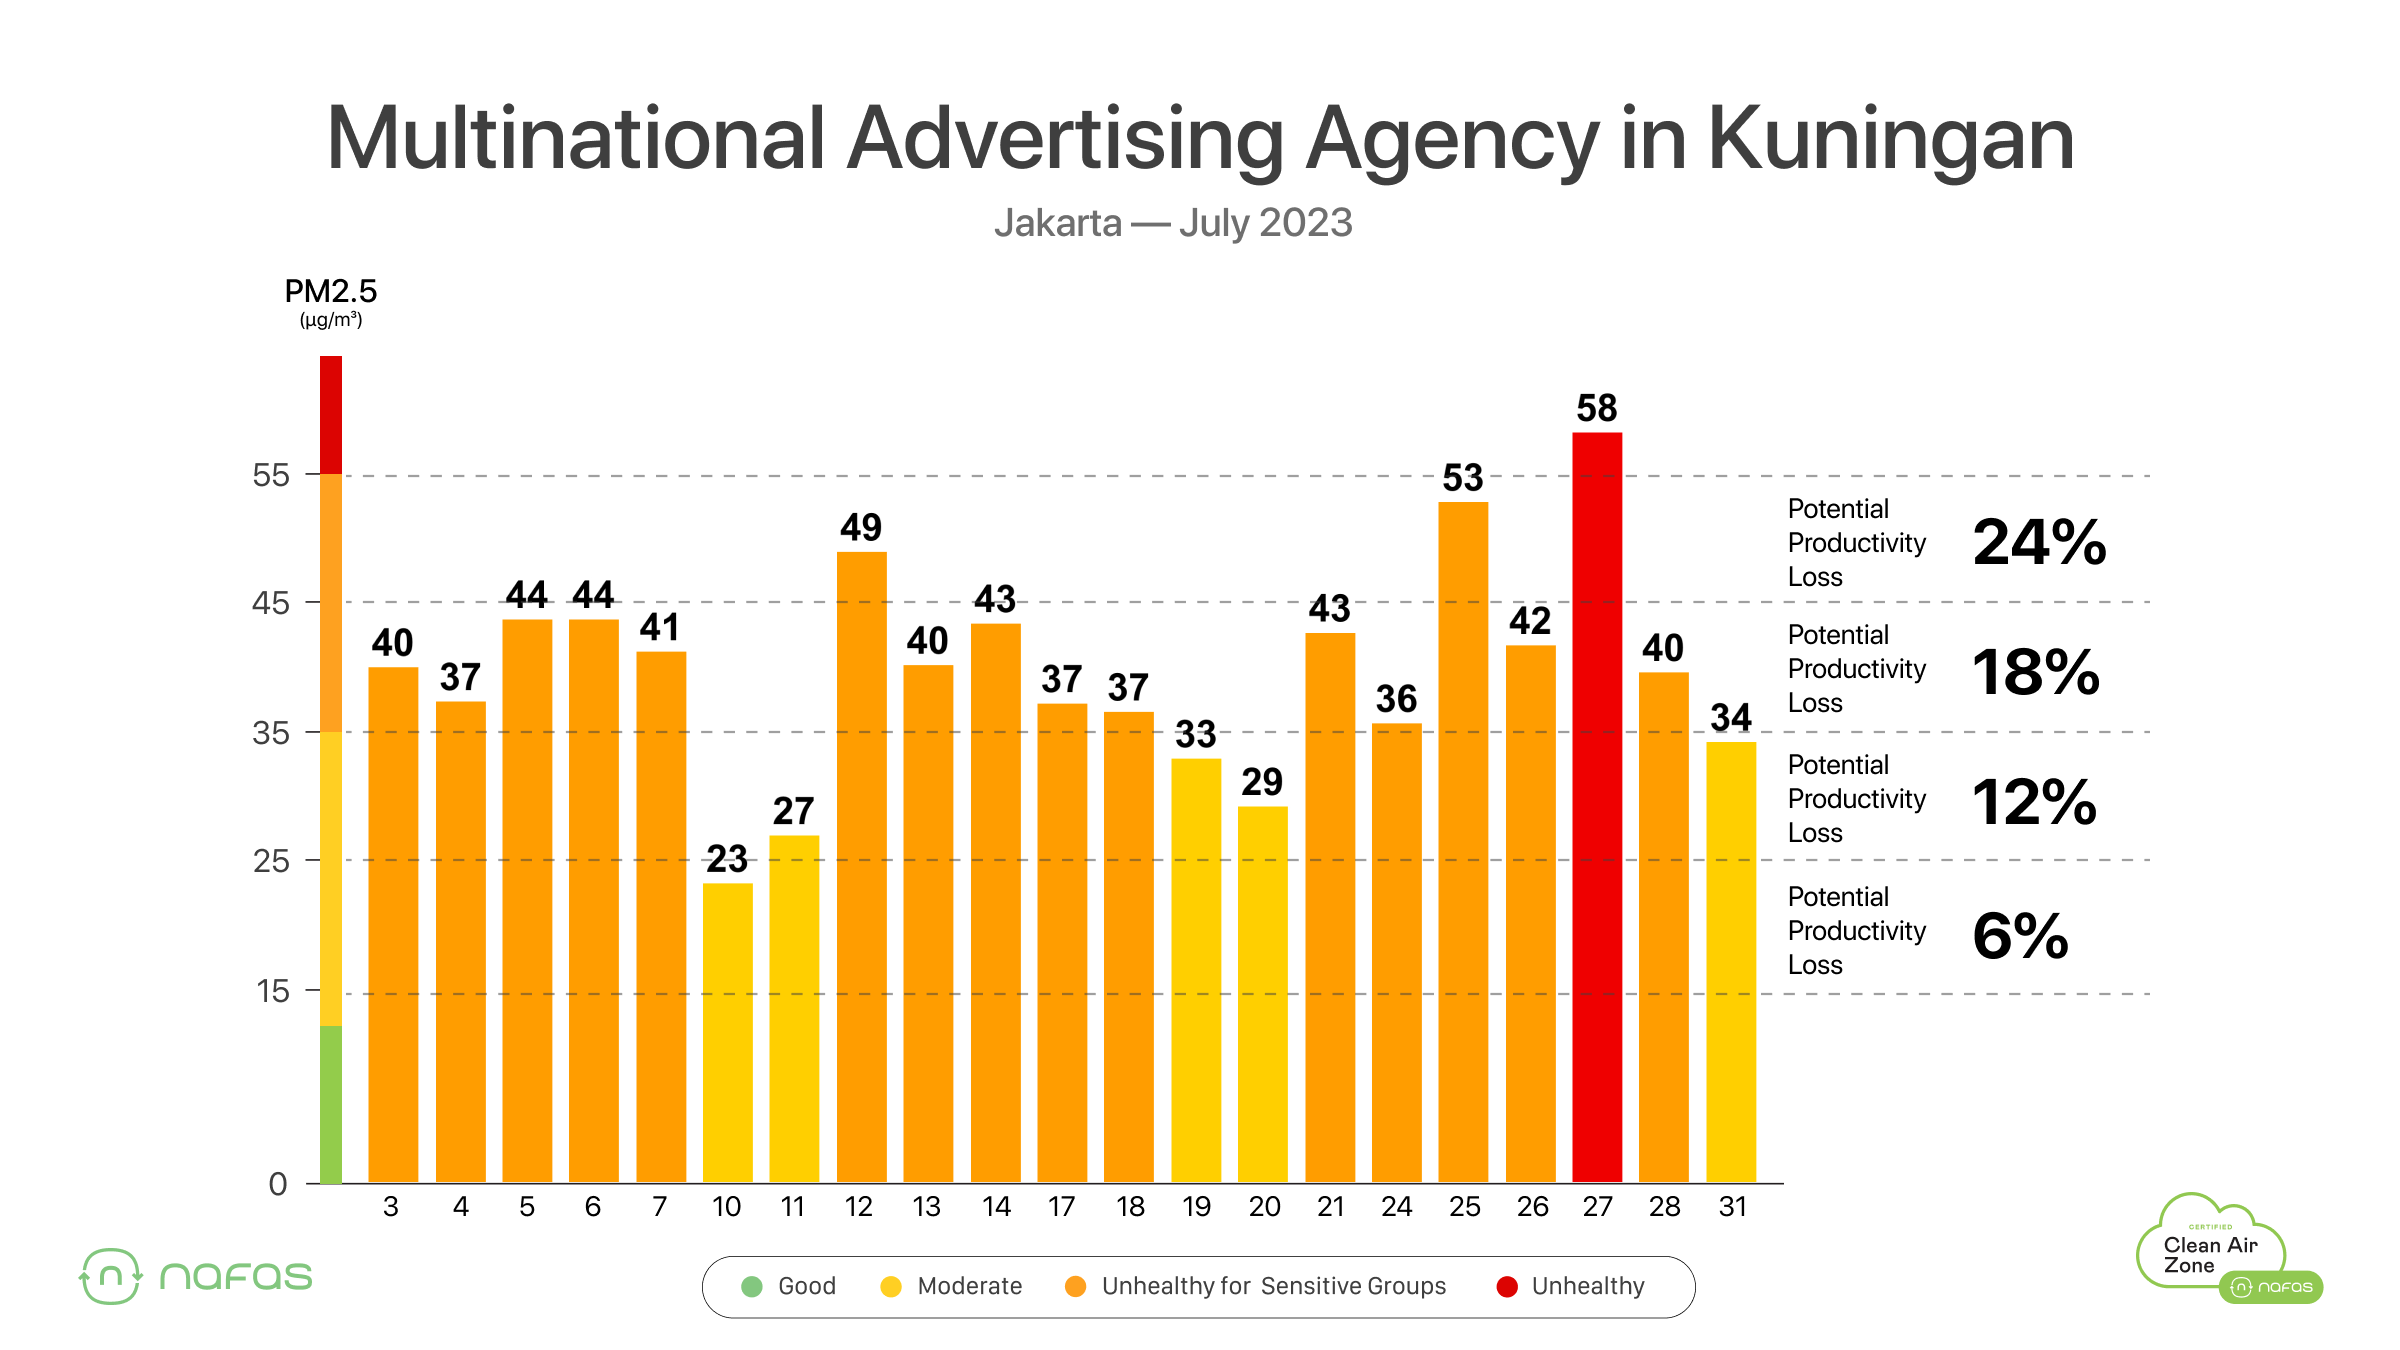
For more information about the impact of PM2.5 on performance at the office, check out the article by clicking here.
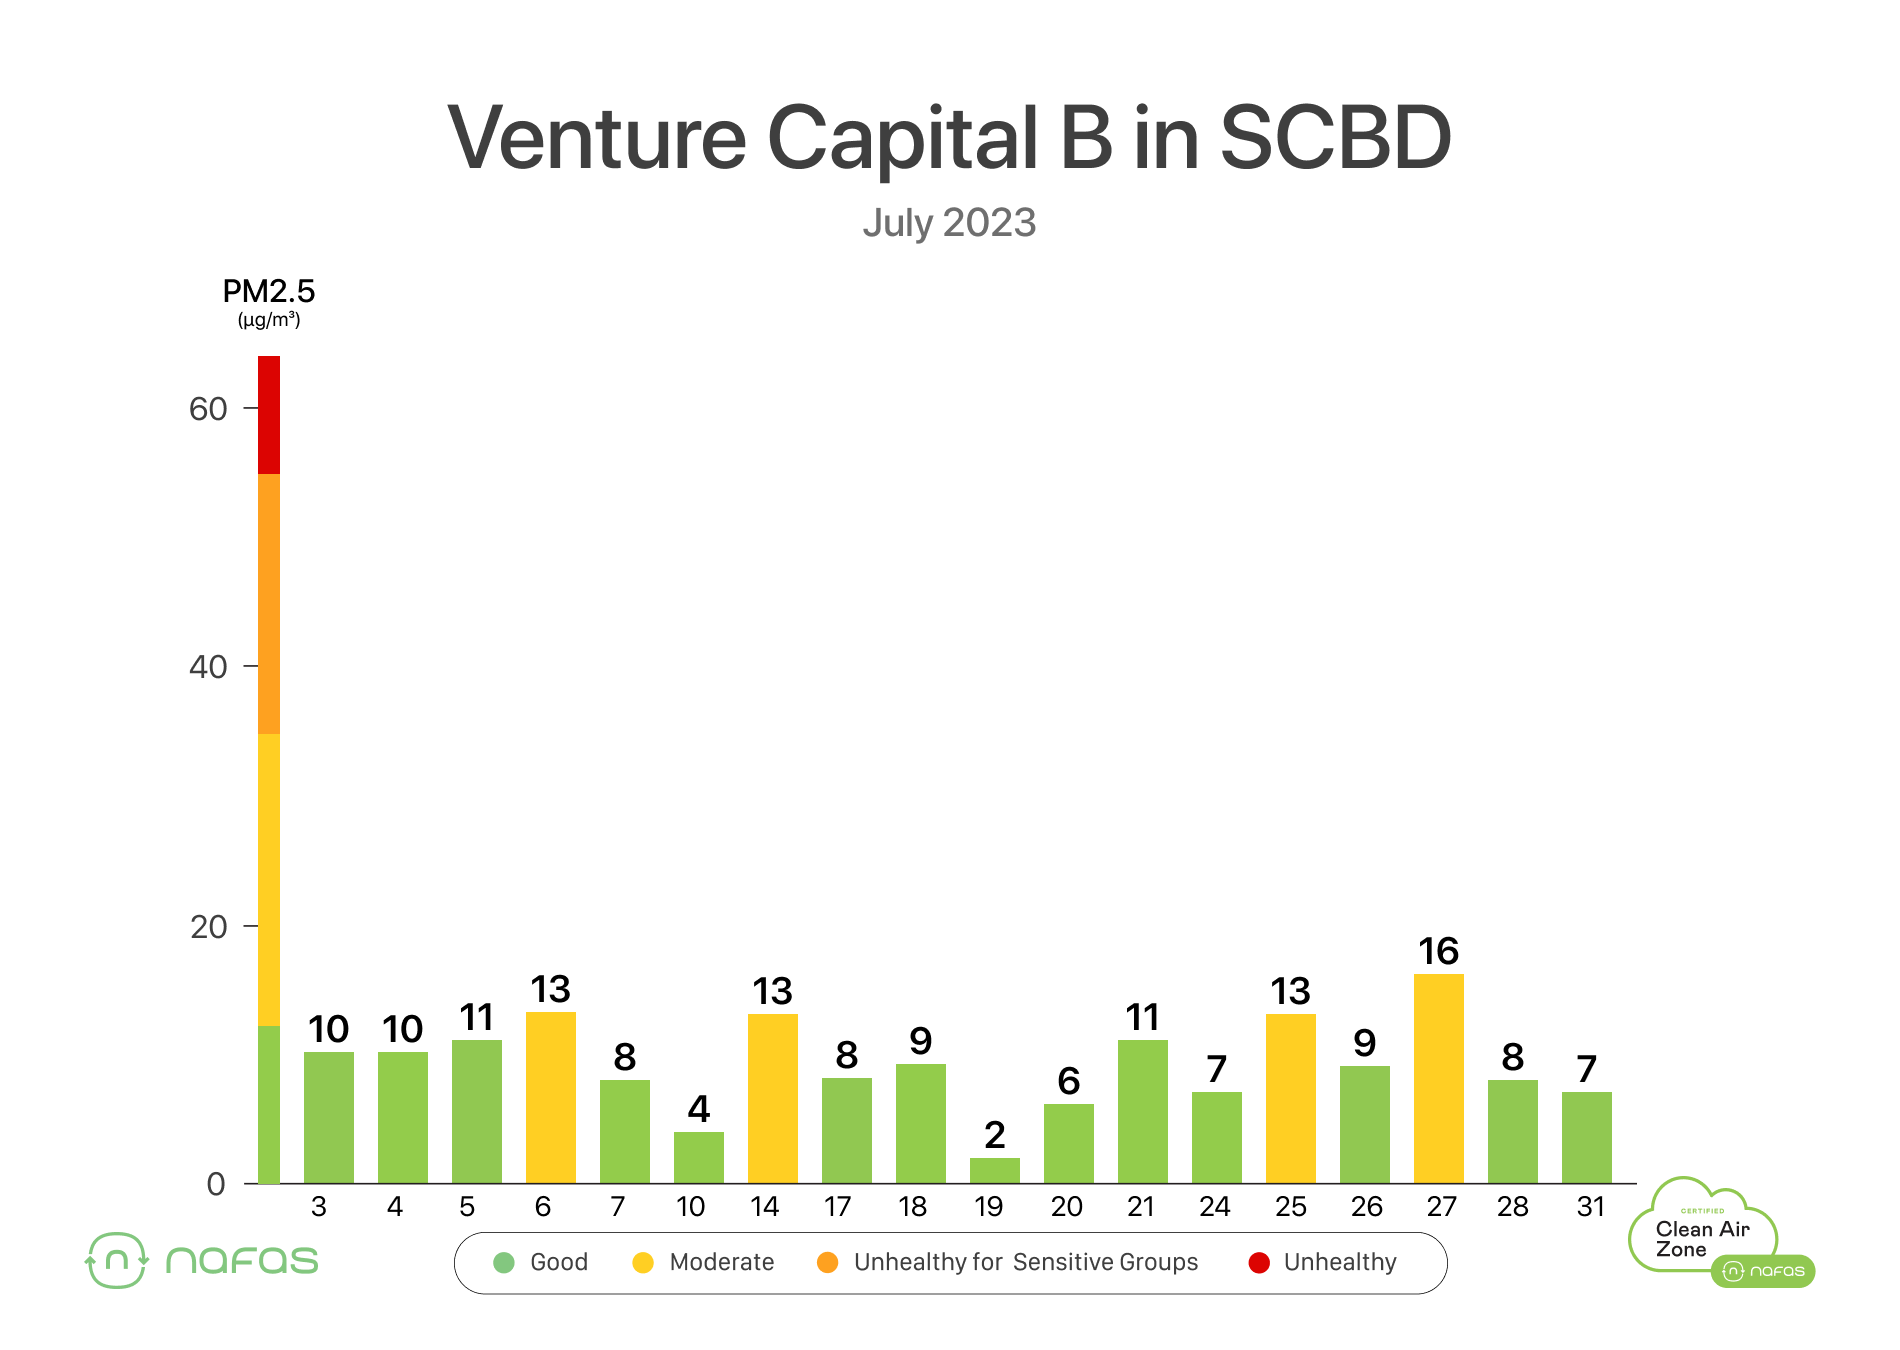
What Does A Healthy Office Look Like?
By now you’re probably wondering, what does “Good” actually look like. Are there even any offices that are good? Let’s answer both those questions.
“Good” air quality in the office means that most of the time, PM2.5 levels are below 12 µg/m3 during work hours. Ideally, the weekly and monthly averages during business hours are below 12 µg/m3.
Here’s what that looks like from a data perspective.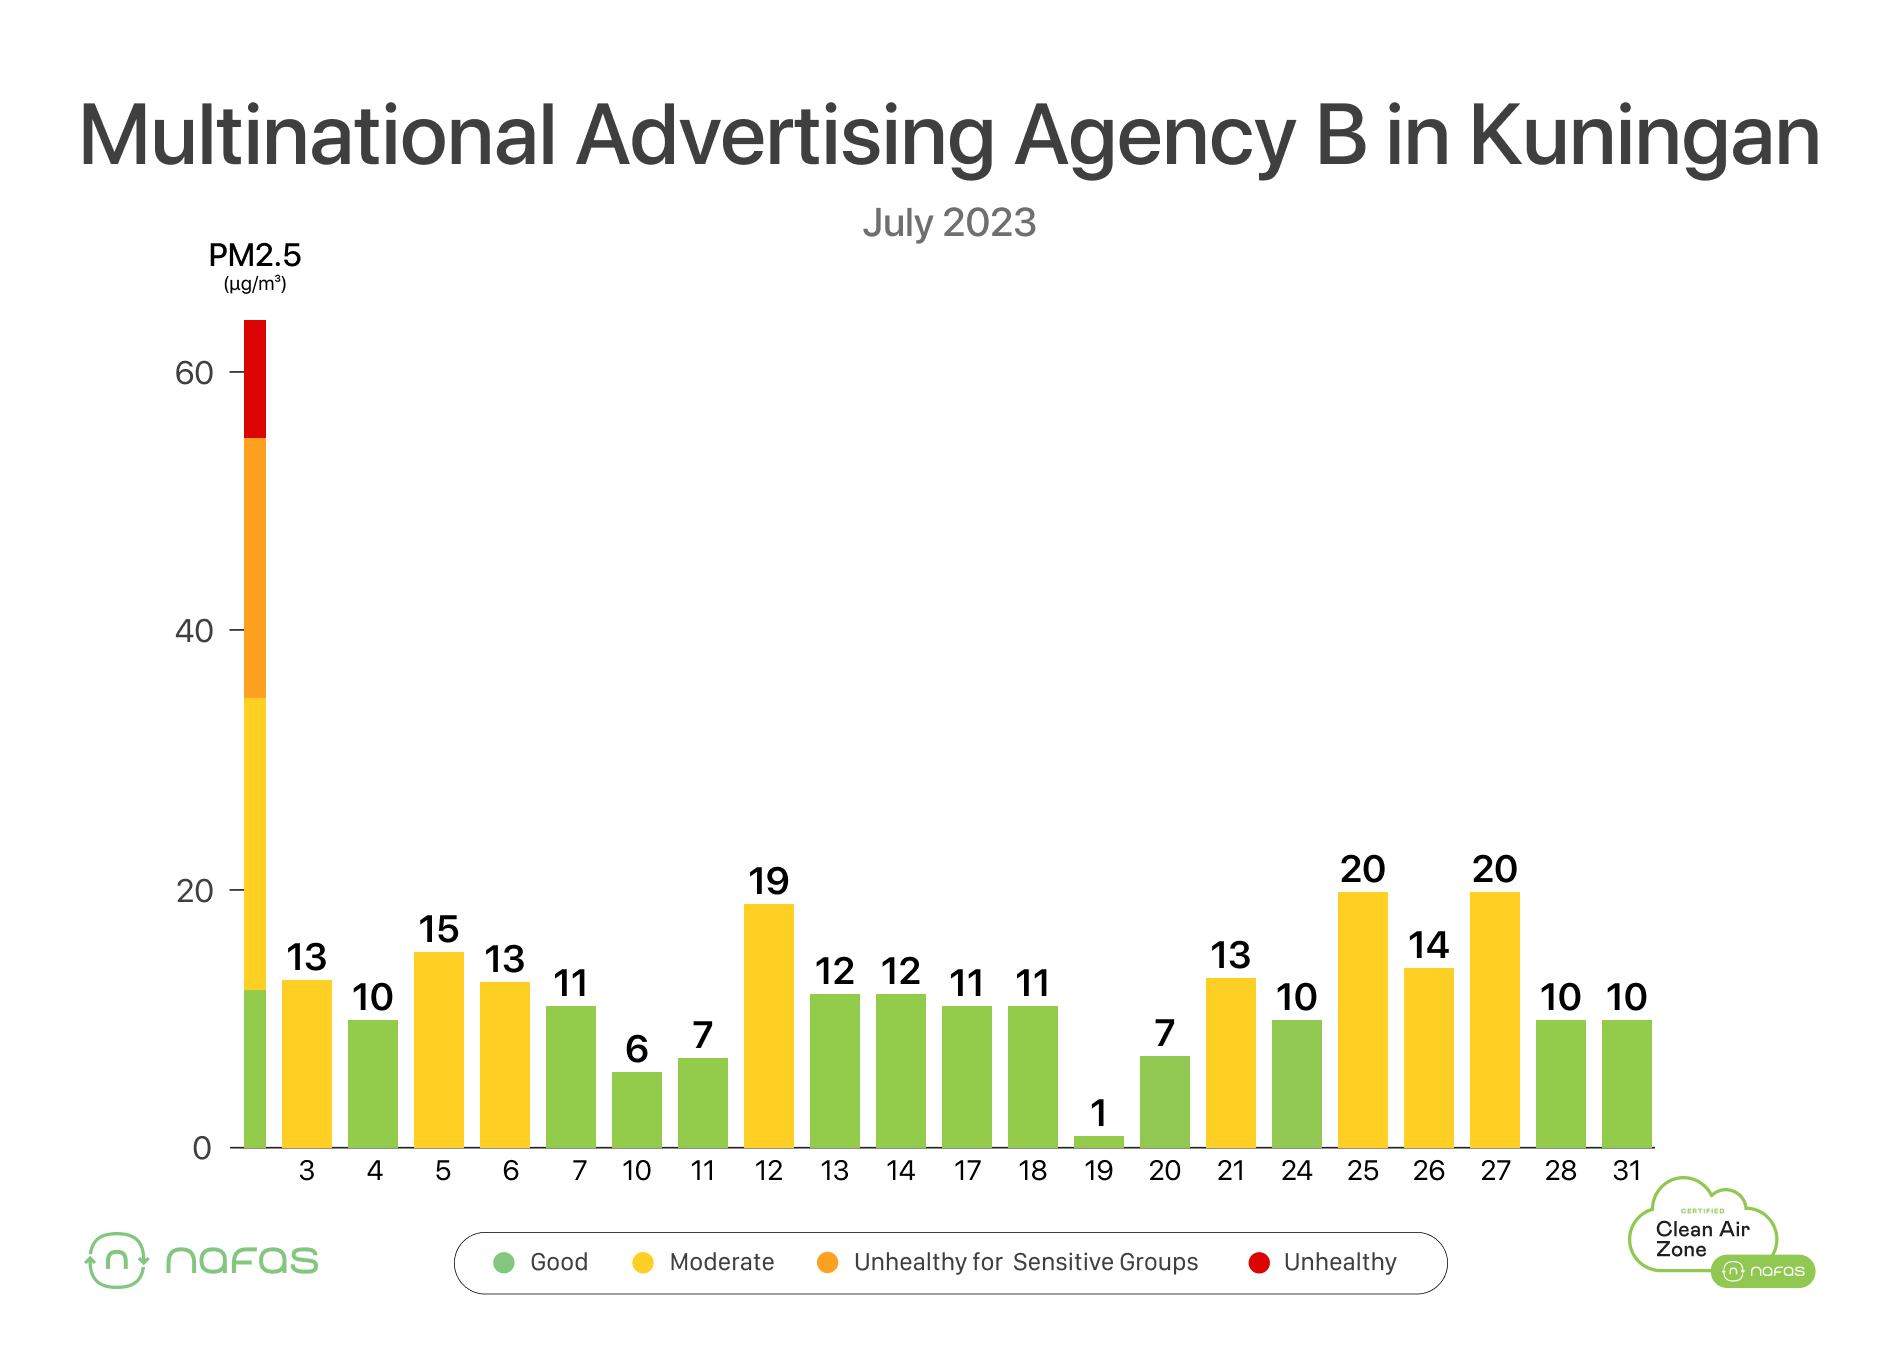
How We Can Make Your Office Healthy
Both the Harvard and USC studies highlighted an impact in performance or productivity above indoor PM2.5 levels of 12 µg/m3 and 15 µg/m3 - coincidentally, these are considered “Good” in the US EPA and ISPU scales.
In order to achieve this in cities where pollution is high - like Jakarta, Bandung or Surabaya - buildings need to implement enhanced filtration strategies.
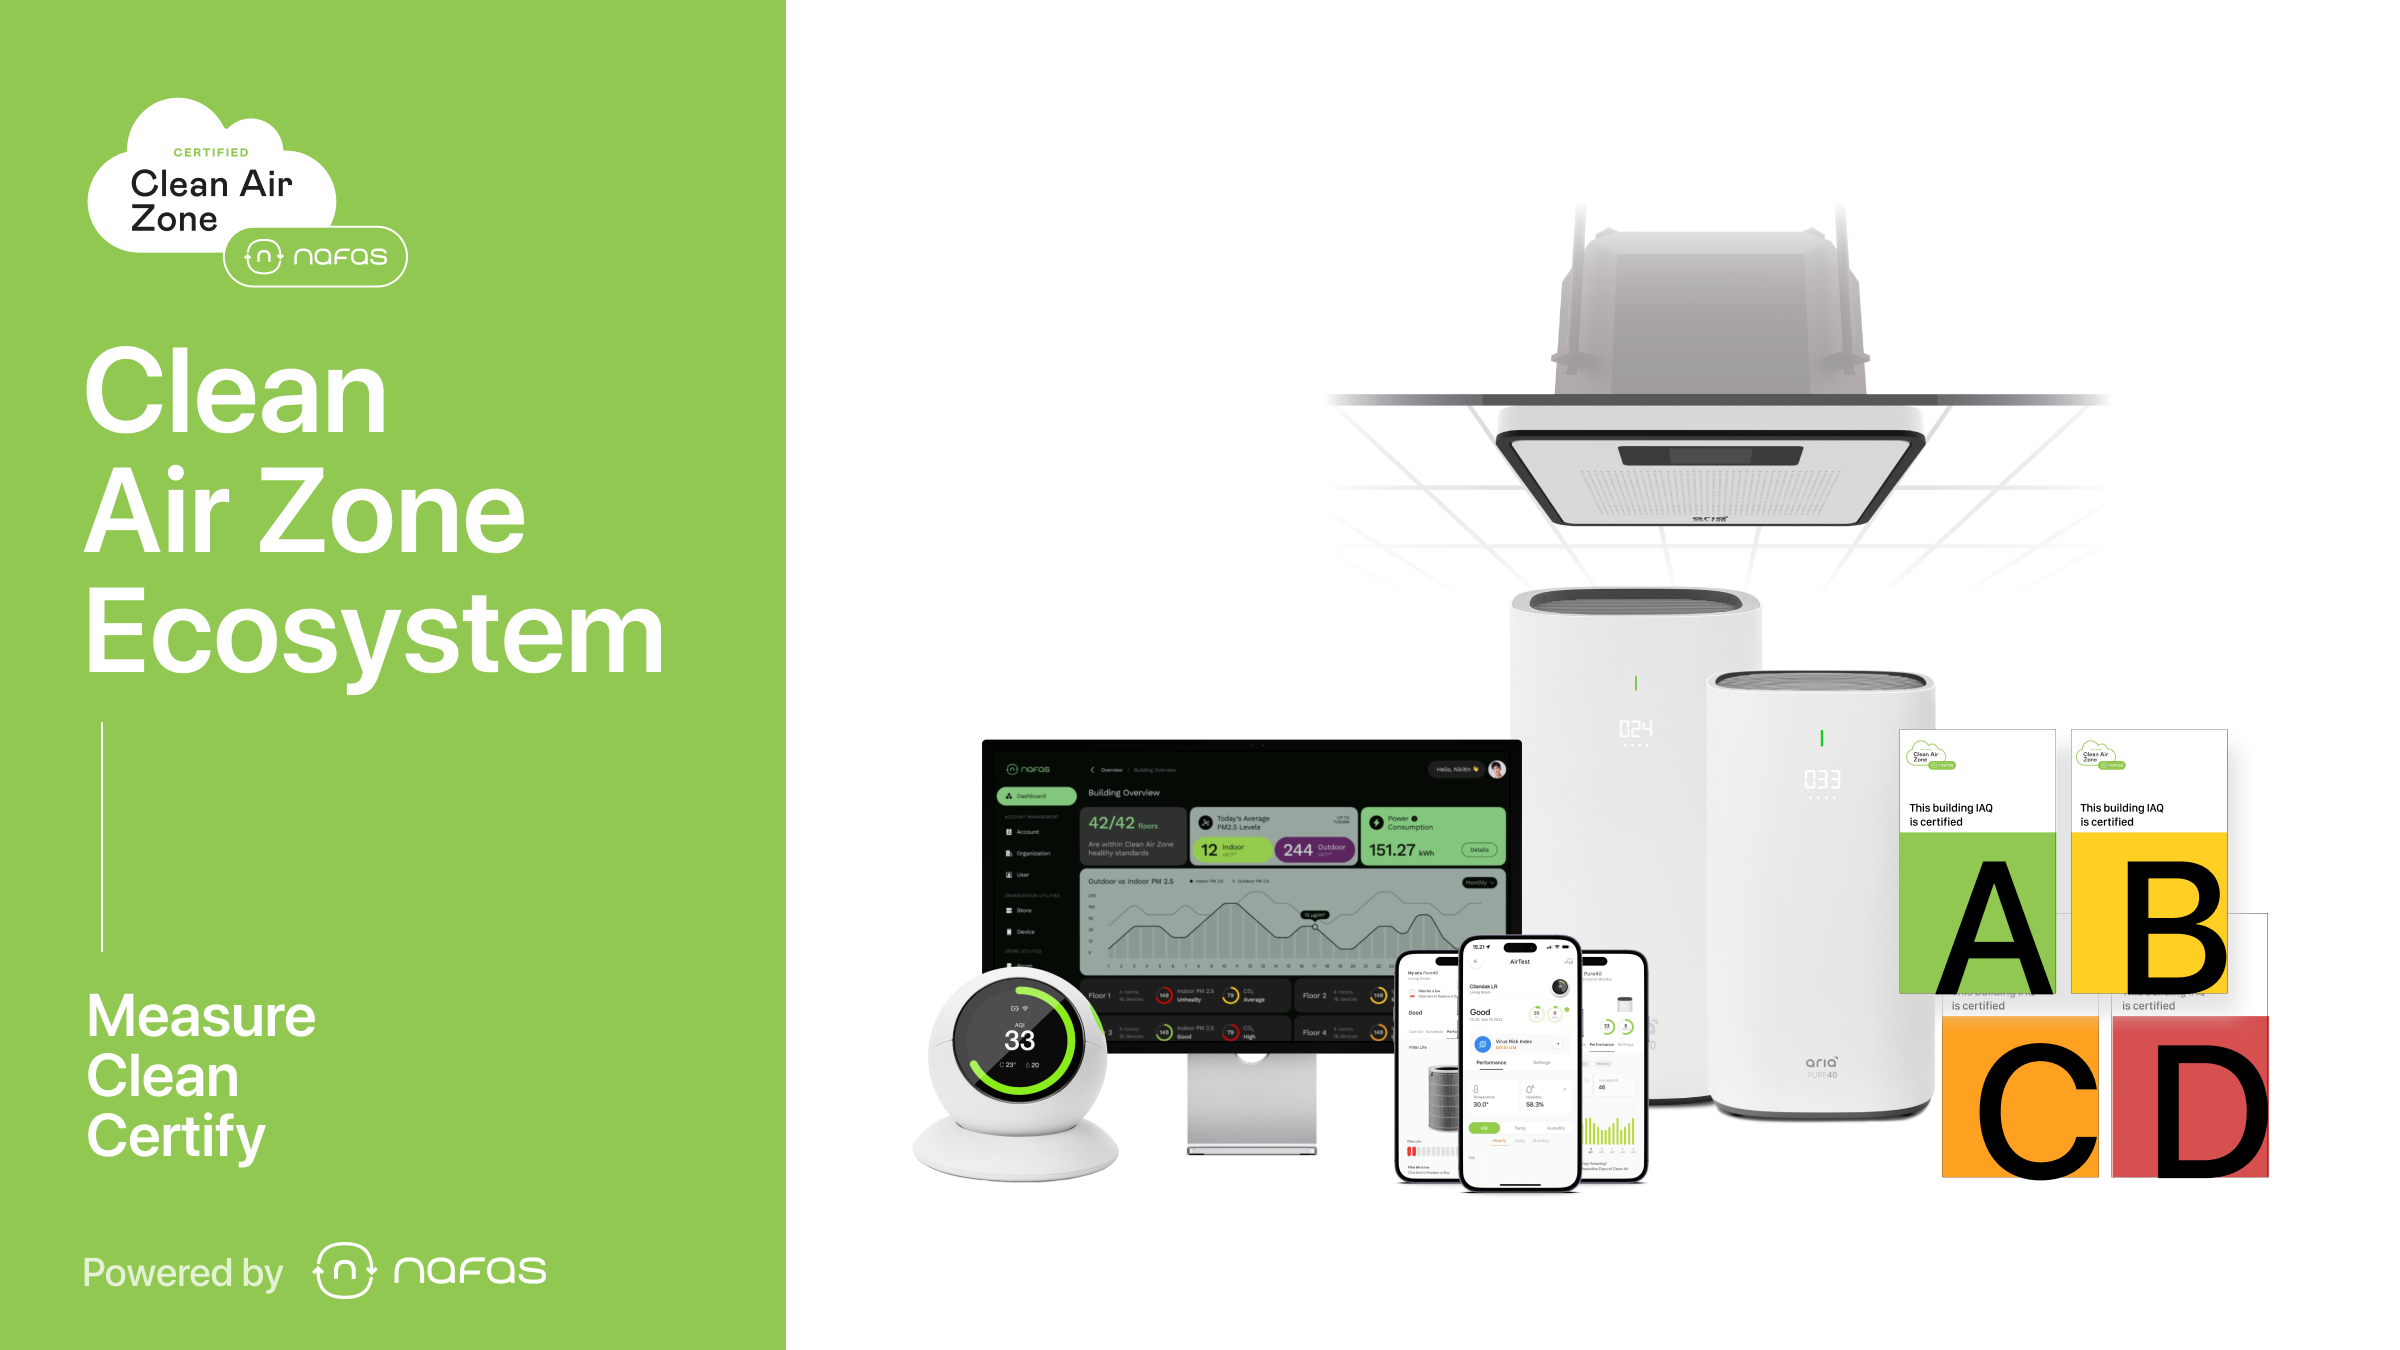
That’s why Nafas has created a subscription service called Clean Air Zones - to bring your business or your building healthy air quality without having to think about it. Through years of development, Nafas has designed an ecosystem that helps companies measure their air pollution levels in their offices, fix the problem, receive a certification and submit as part of their ESG reporting on platforms such as GRI, MSCI, Sustainlytics, Moody’s and many others.
Becoming a Clean Air Zone takes 3 easy steps:
1. Nafas conducts a diagnostic and each location receives an AirScore
2. Based on the AirScore, Nafas provides a plan of action & subscription proposal
3. Nafas installs automated healthy air ecosystem, performs calibrations and makes the data available on a personalized dashboard.
And the best part?
We do everything for you.
Want to see what the results look like? Here are 3 offices which have been turned into Clean Air Zones!
Turn Your Office Into A Clean Air Zone
Nafas has worked with offices in Kuningan, Thamrin, Sudirman and SCBD to measure the air pollution levels indoors and to convert the offices into Clean Air Zones.
Becoming a Clean Air Zone is So Easy
Interested in ensuring healthy air quality in your office, gym, school, or home at all times? Feel free to contact us at [email protected] or click the link below. Let's join our mission to make clean air the standard in our offices!