LEARN / ARTICLE
How indoor Air Pollution Impacts Performances in Offices
Keypoints:
- Nafas measures PM2.5, with WHO's safe level at 5 µg/m³. Jakarta’s July 2023 average was 47 µg/m³.
- PM2.5 causes inflammation and is linked to respiratory, cardiovascular issues, and cognitive decline.
- Office workers performed worse in 80% of tasks when PM2.5 exceeded 12 µg/m³.
- A 10 µg/m³ PM2.5 rise led to a 6% drop in worker productivity.
We recently published "Our Buildings Are Broken" which reflects on years of research that Nafas has done to learn more about how air pollution impacts our day to day lives.
A Quick Review of Air Quality Data Readings
If you’re new to the air quality space, we’ll quickly review some of the numbers and colors you will see.
What do the numbers mean? Nafas measures concentrations of PM2.5 in the air, which are measured in ug/m3. The World Health Organization yearly recommended guideline of PM2.5 exposure for humans is 5 µg/m3. For reference, Jakarta’s average in July 2023 was 47 µg/m3.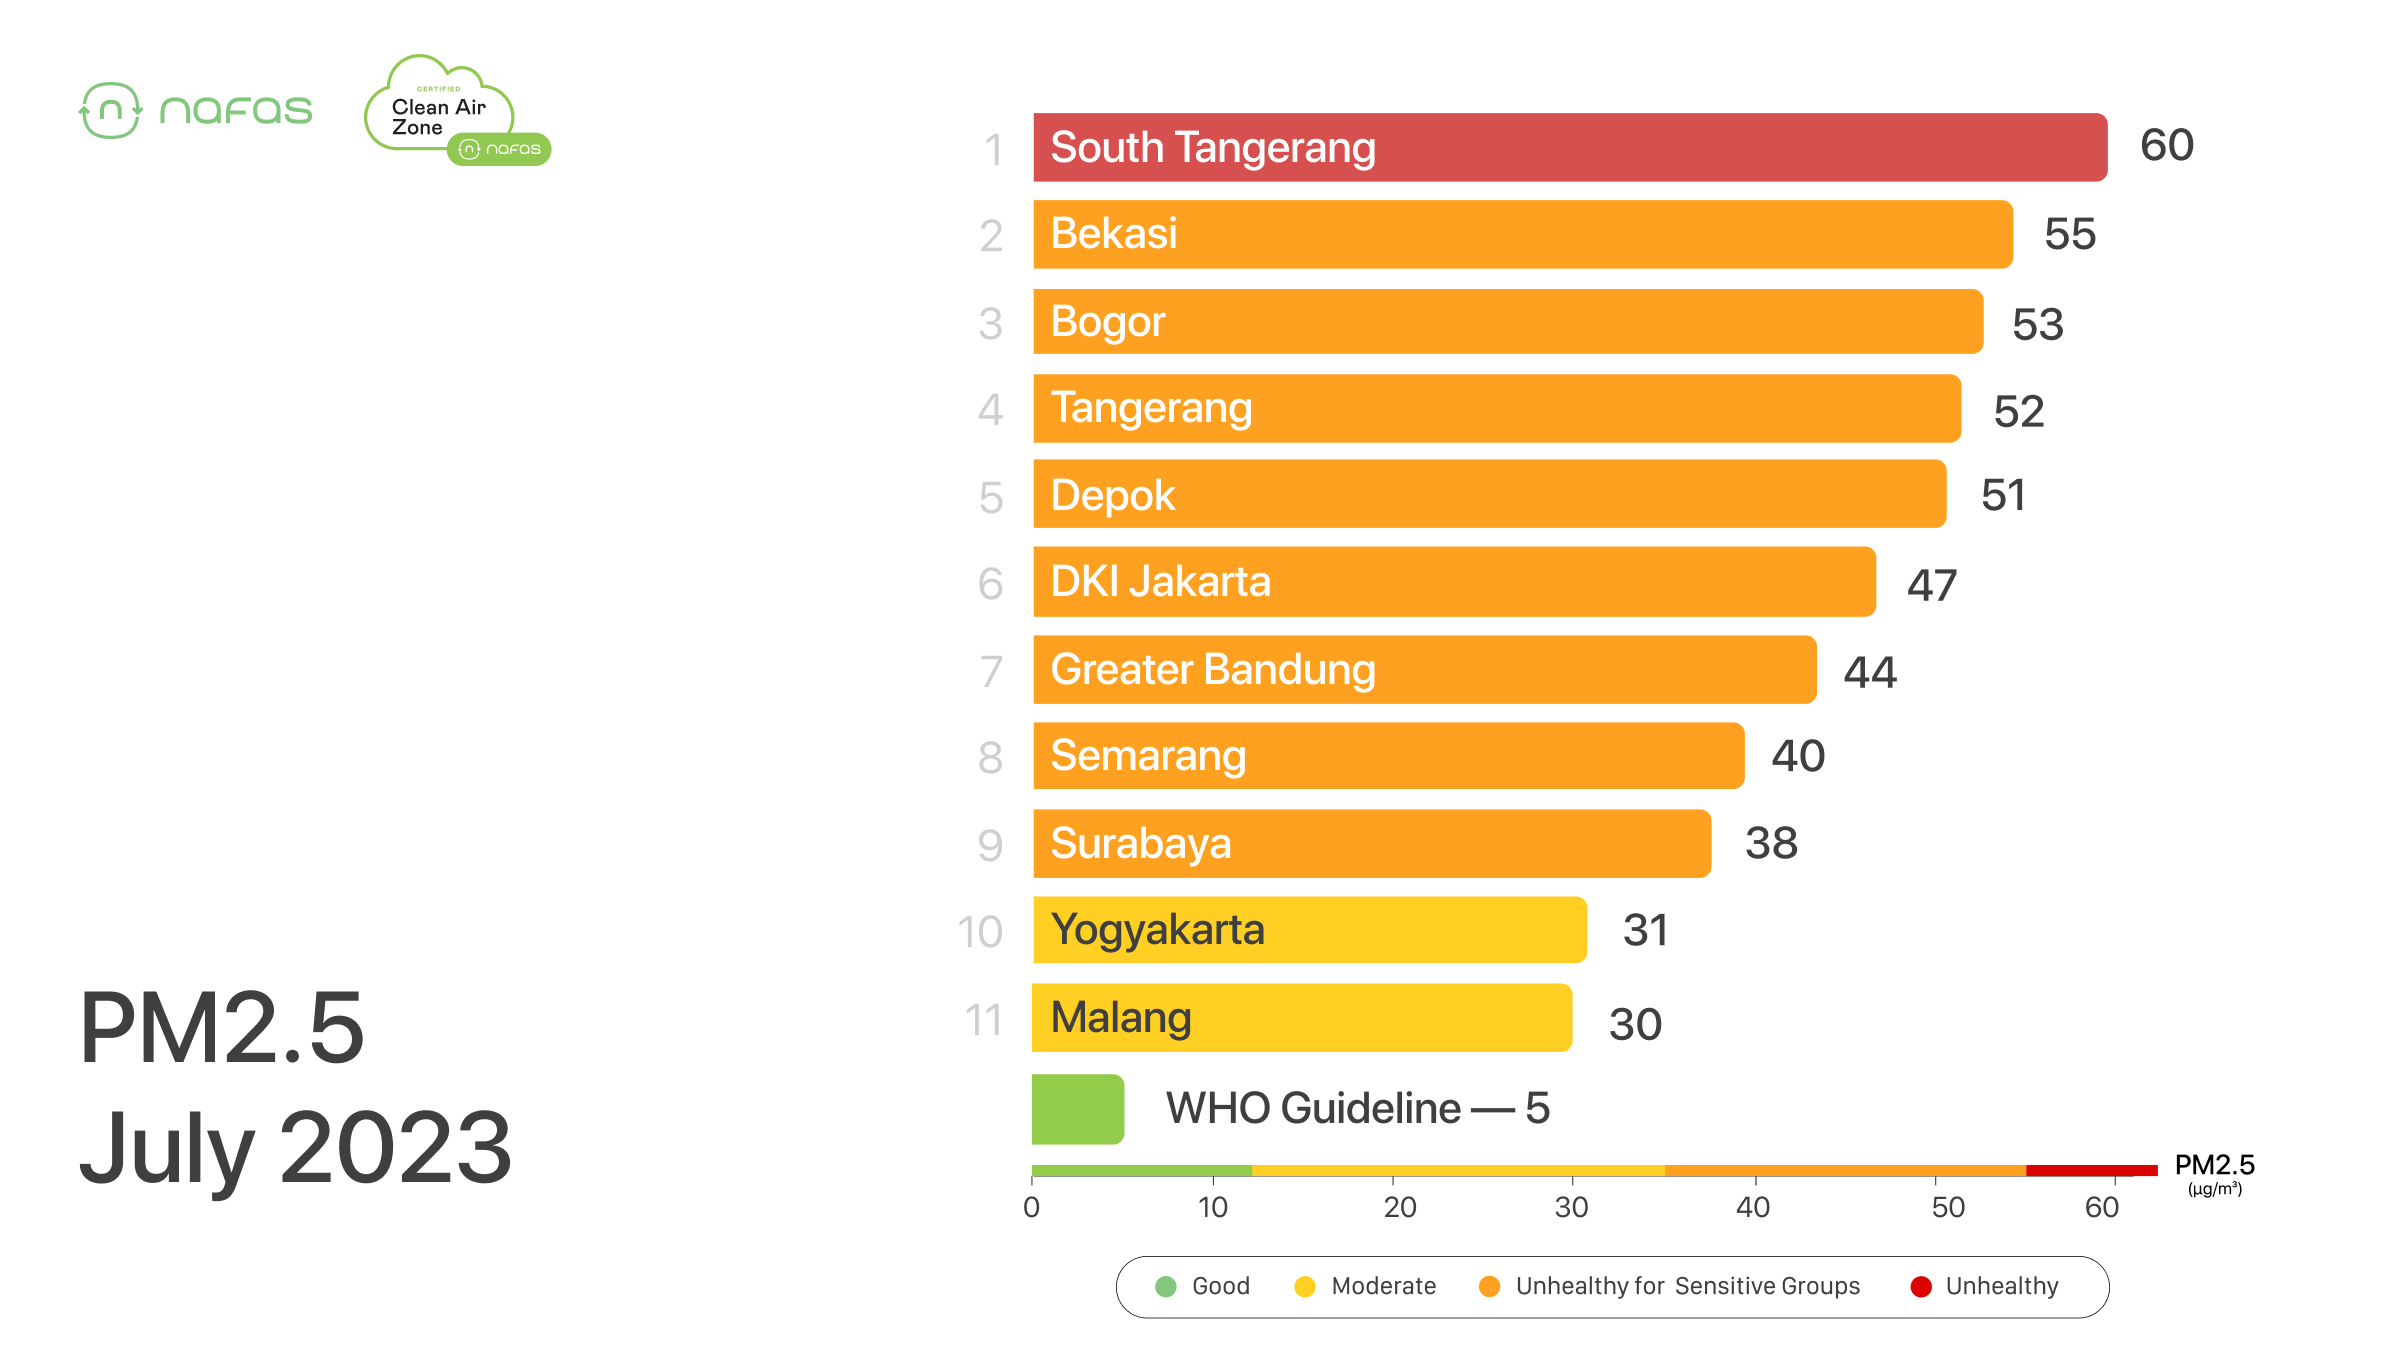
What do the colors mean? Nafas references the US EPA scale for healthy air quality as it is one of the most stringent but also recognized around the world. You can see how the US EPA scale compares to the Indonesian ISPU scale and the Chinese scale below.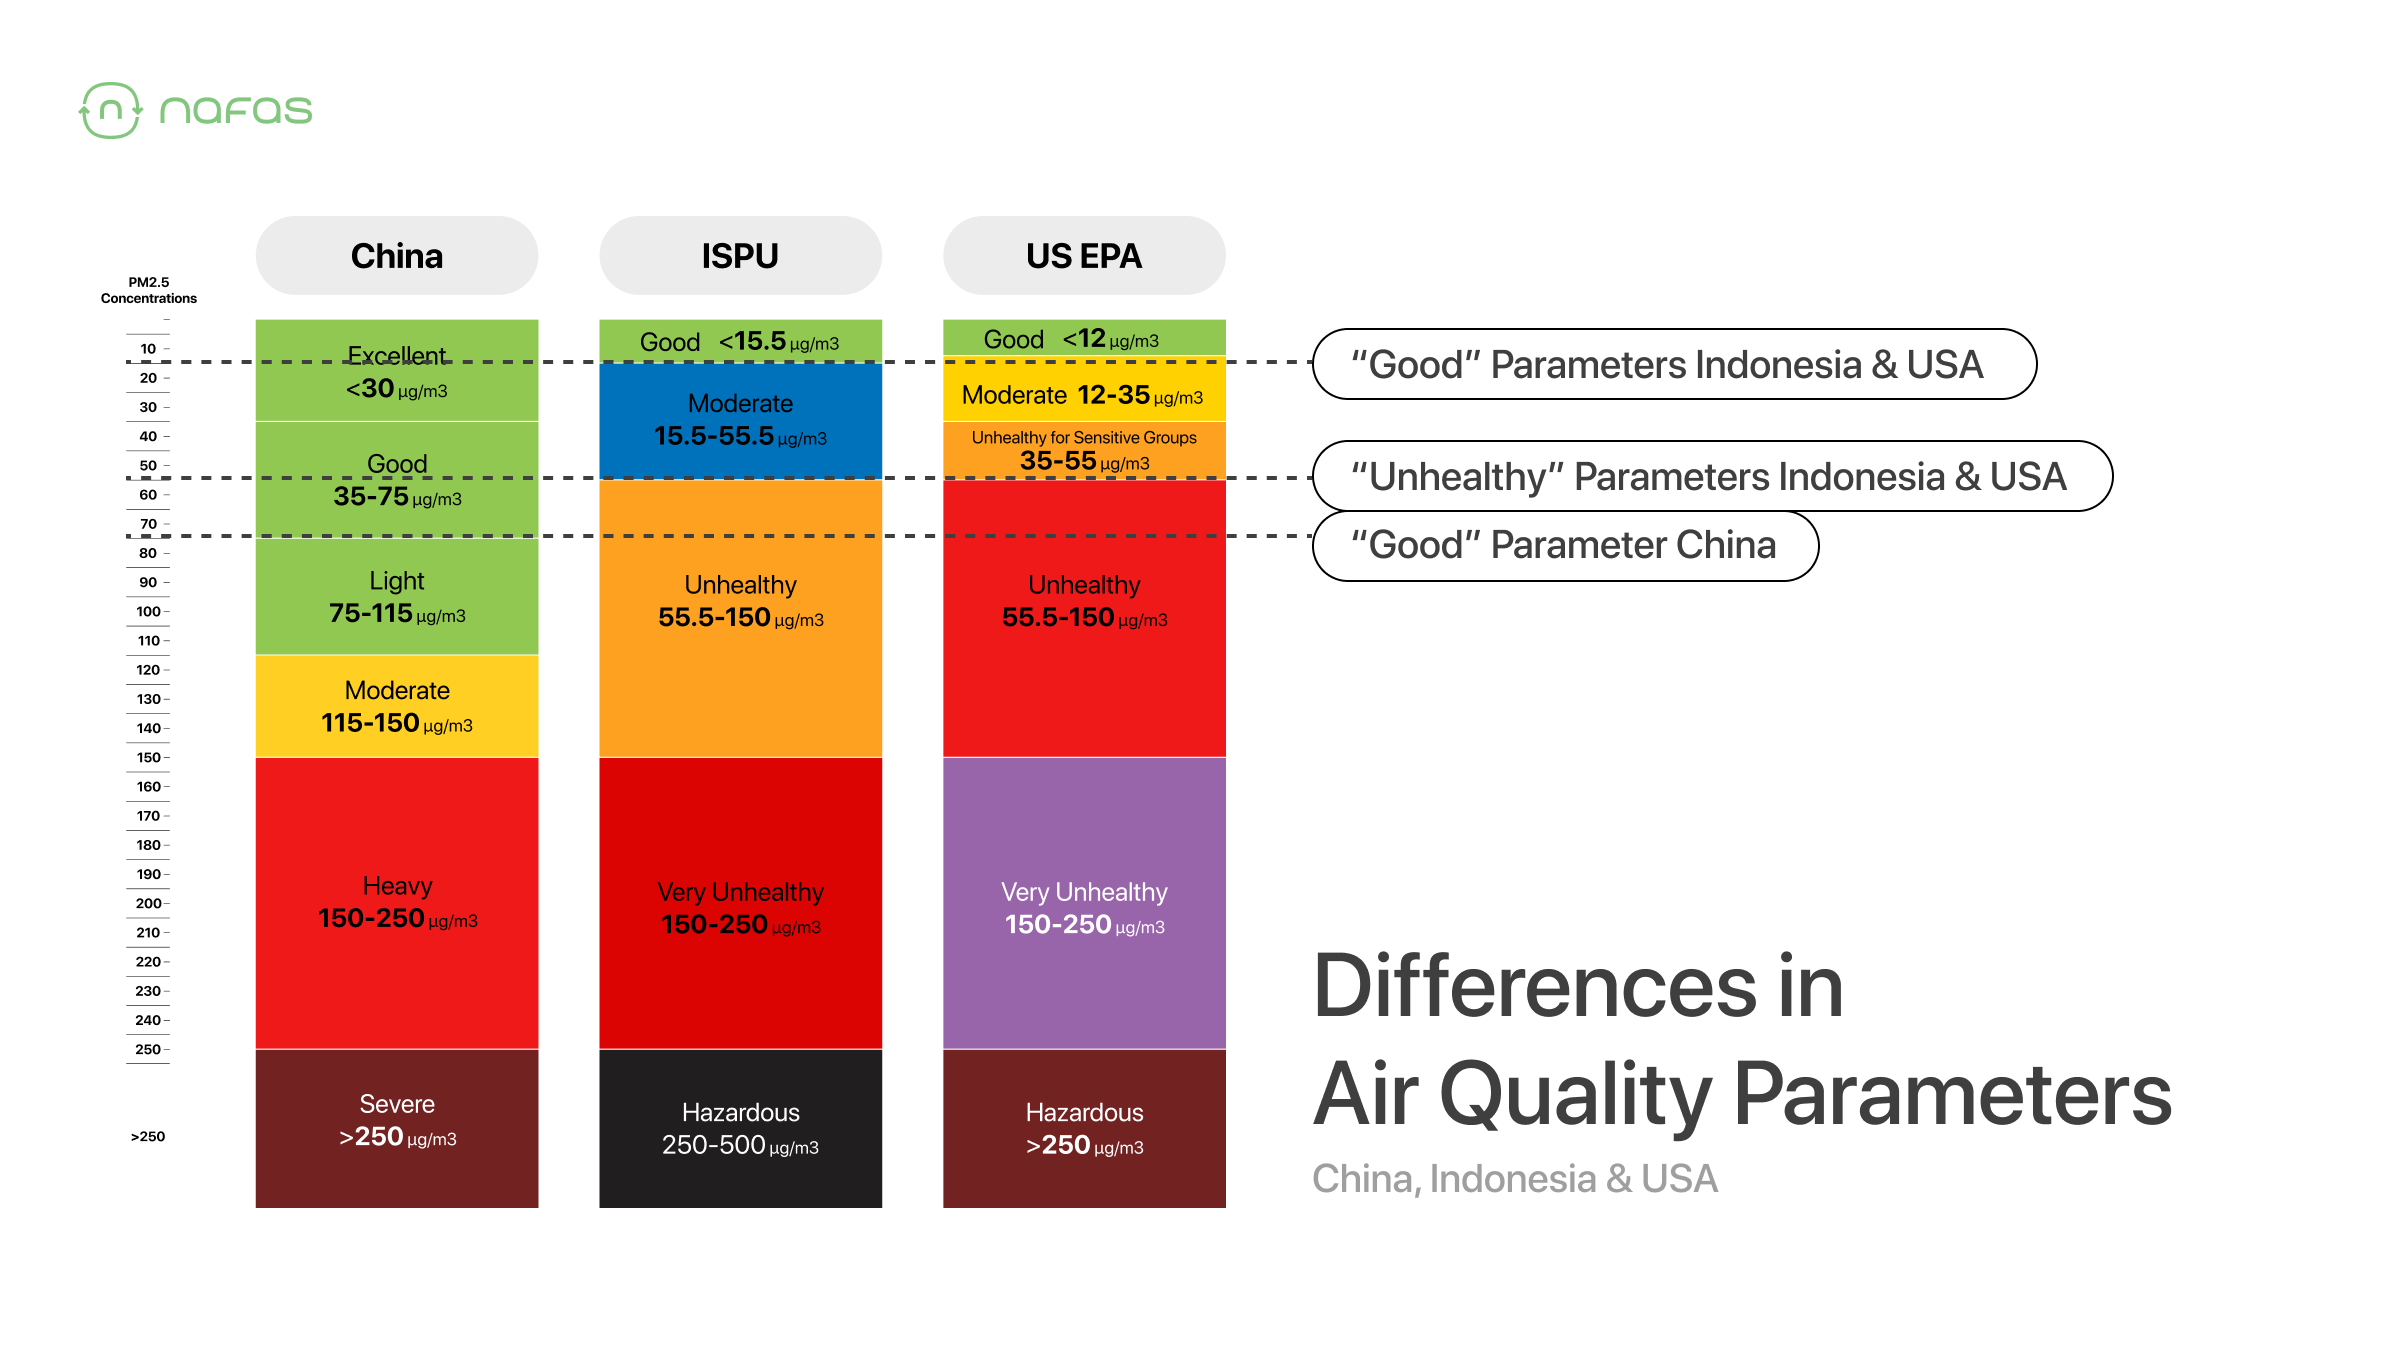
Since you now know how to measure it, to get a better idea of how air pollution impacts our performance in the office let’s first take a look at how it impacts our bodies.
Understanding PM2.5 and its Inflammatory Effects
PM2.5 refers to fine particulate matter with a diameter of 2.5 microns or less. These tiny particles are commonly associated with burning stuff, such as emissions from vehicles, power plants, and even trash burning. When inhaled, PM2.5 particles can penetrate deep into the lungs and even enter the bloodstream, causing systemic inflammation.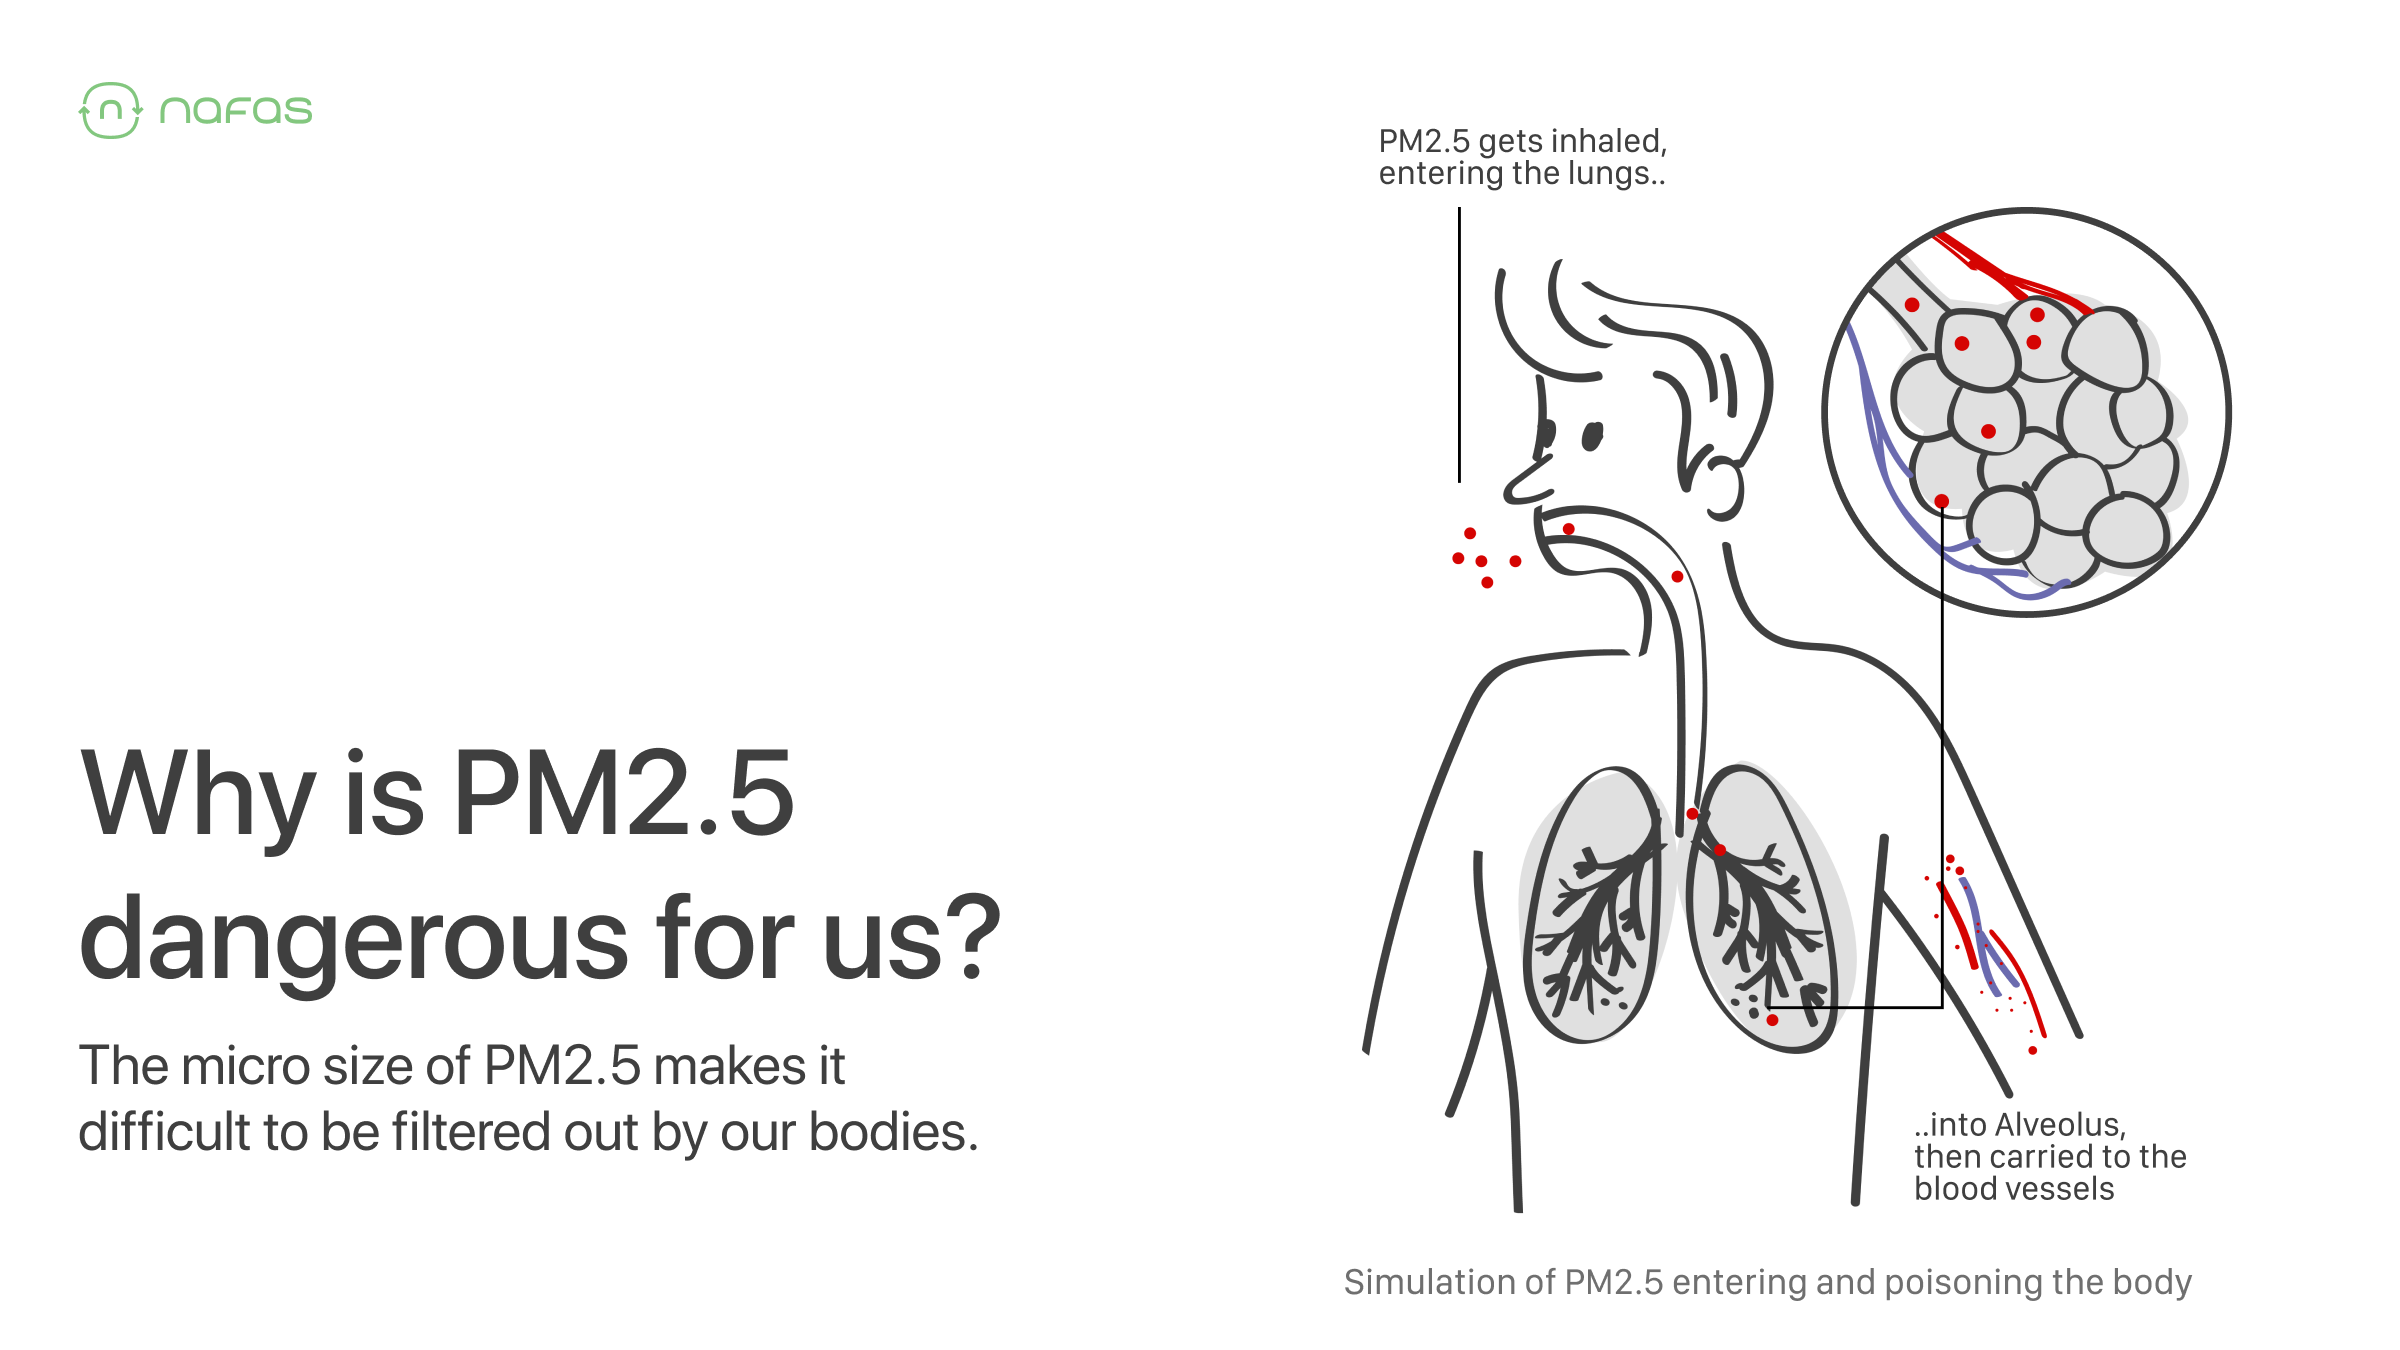
This inflammatory response is triggered by the body's immune system as it recognises the foreign particles and releases pro-inflammatory mediators to combat them. Prolonged exposure to PM2.5 can lead to chronic inflammation, which has been linked to various health problems, including respiratory and cardiovascular diseases.
Recent studies from universities such as Harvard and MIT have found that PM2.5 also has significant short term impact, in particular on our respiratory and cognitive performance.
Chess players make 26% more mistakes in high air pollution?
A study titled “Indoor Air Quality and Strategic Decision Making” conducted by researchers at MIT examined the impact of air pollution, specifically PM2.5, on the performance of chess players. The results showed a clear association between higher levels of PM2.5 and decreased performance among the chess players.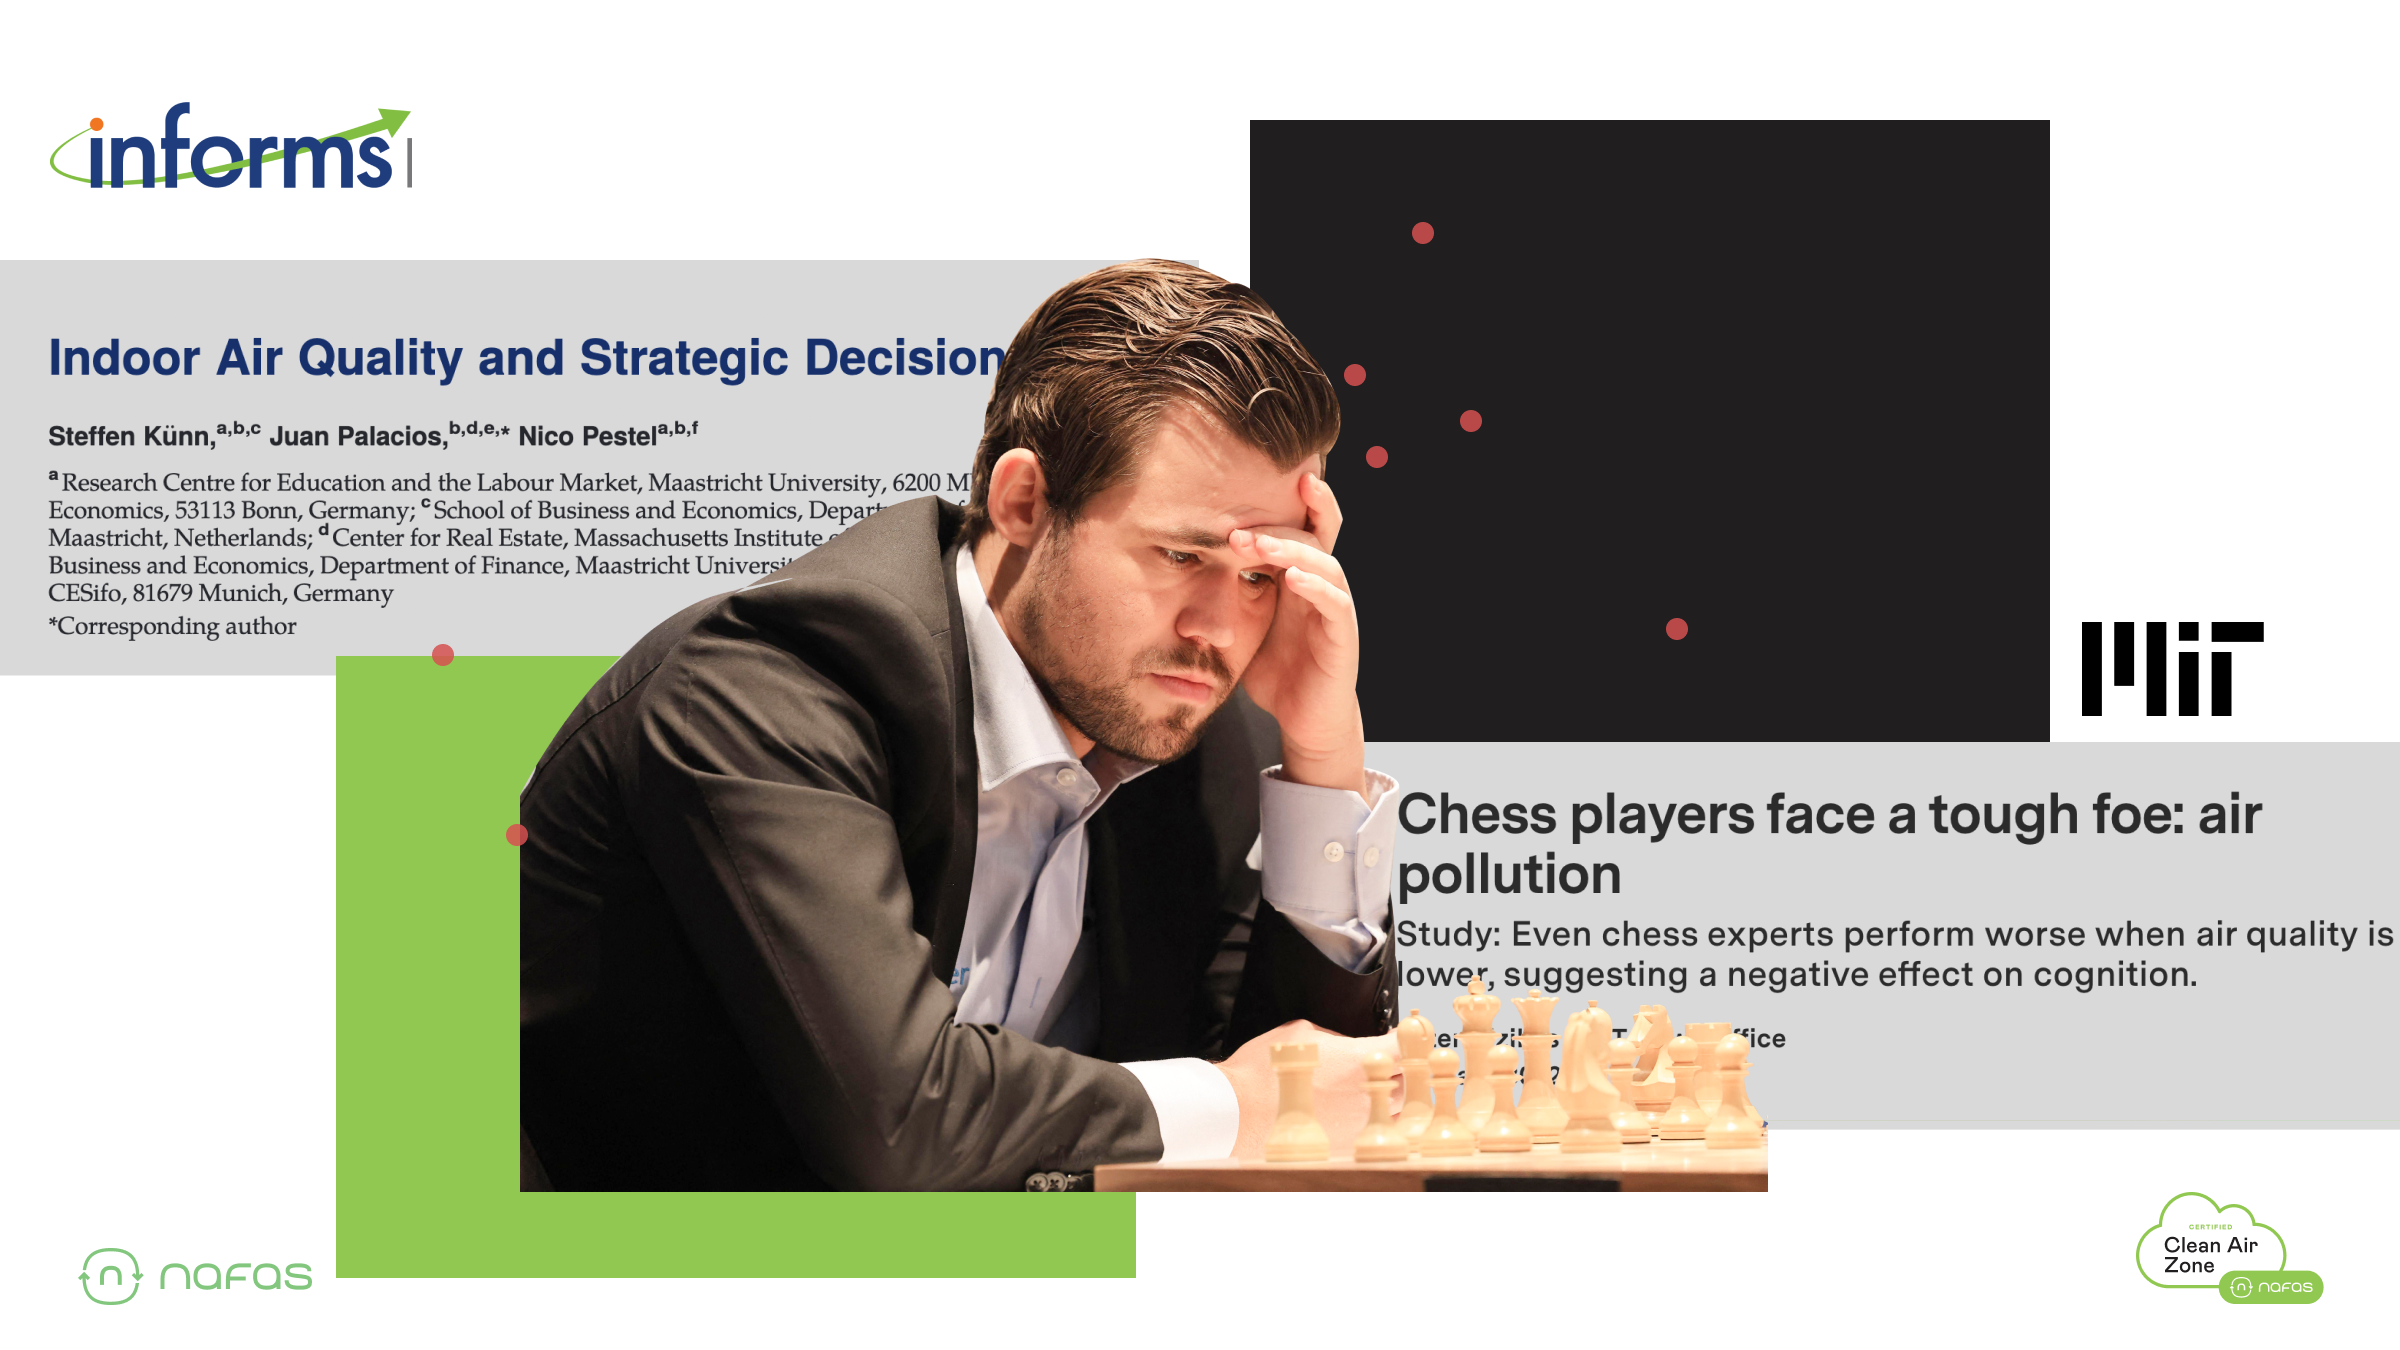
Researchers found that an increase in the indoor concentration of fine particulate matter (PM2.5) by 10 μg/m3 increased a player’s probability of making an erroneous move by 26.3%.
To put things into perspective, let’s take a look at some indoor air quality data from a highly stressful office environment - a Venture Capital office.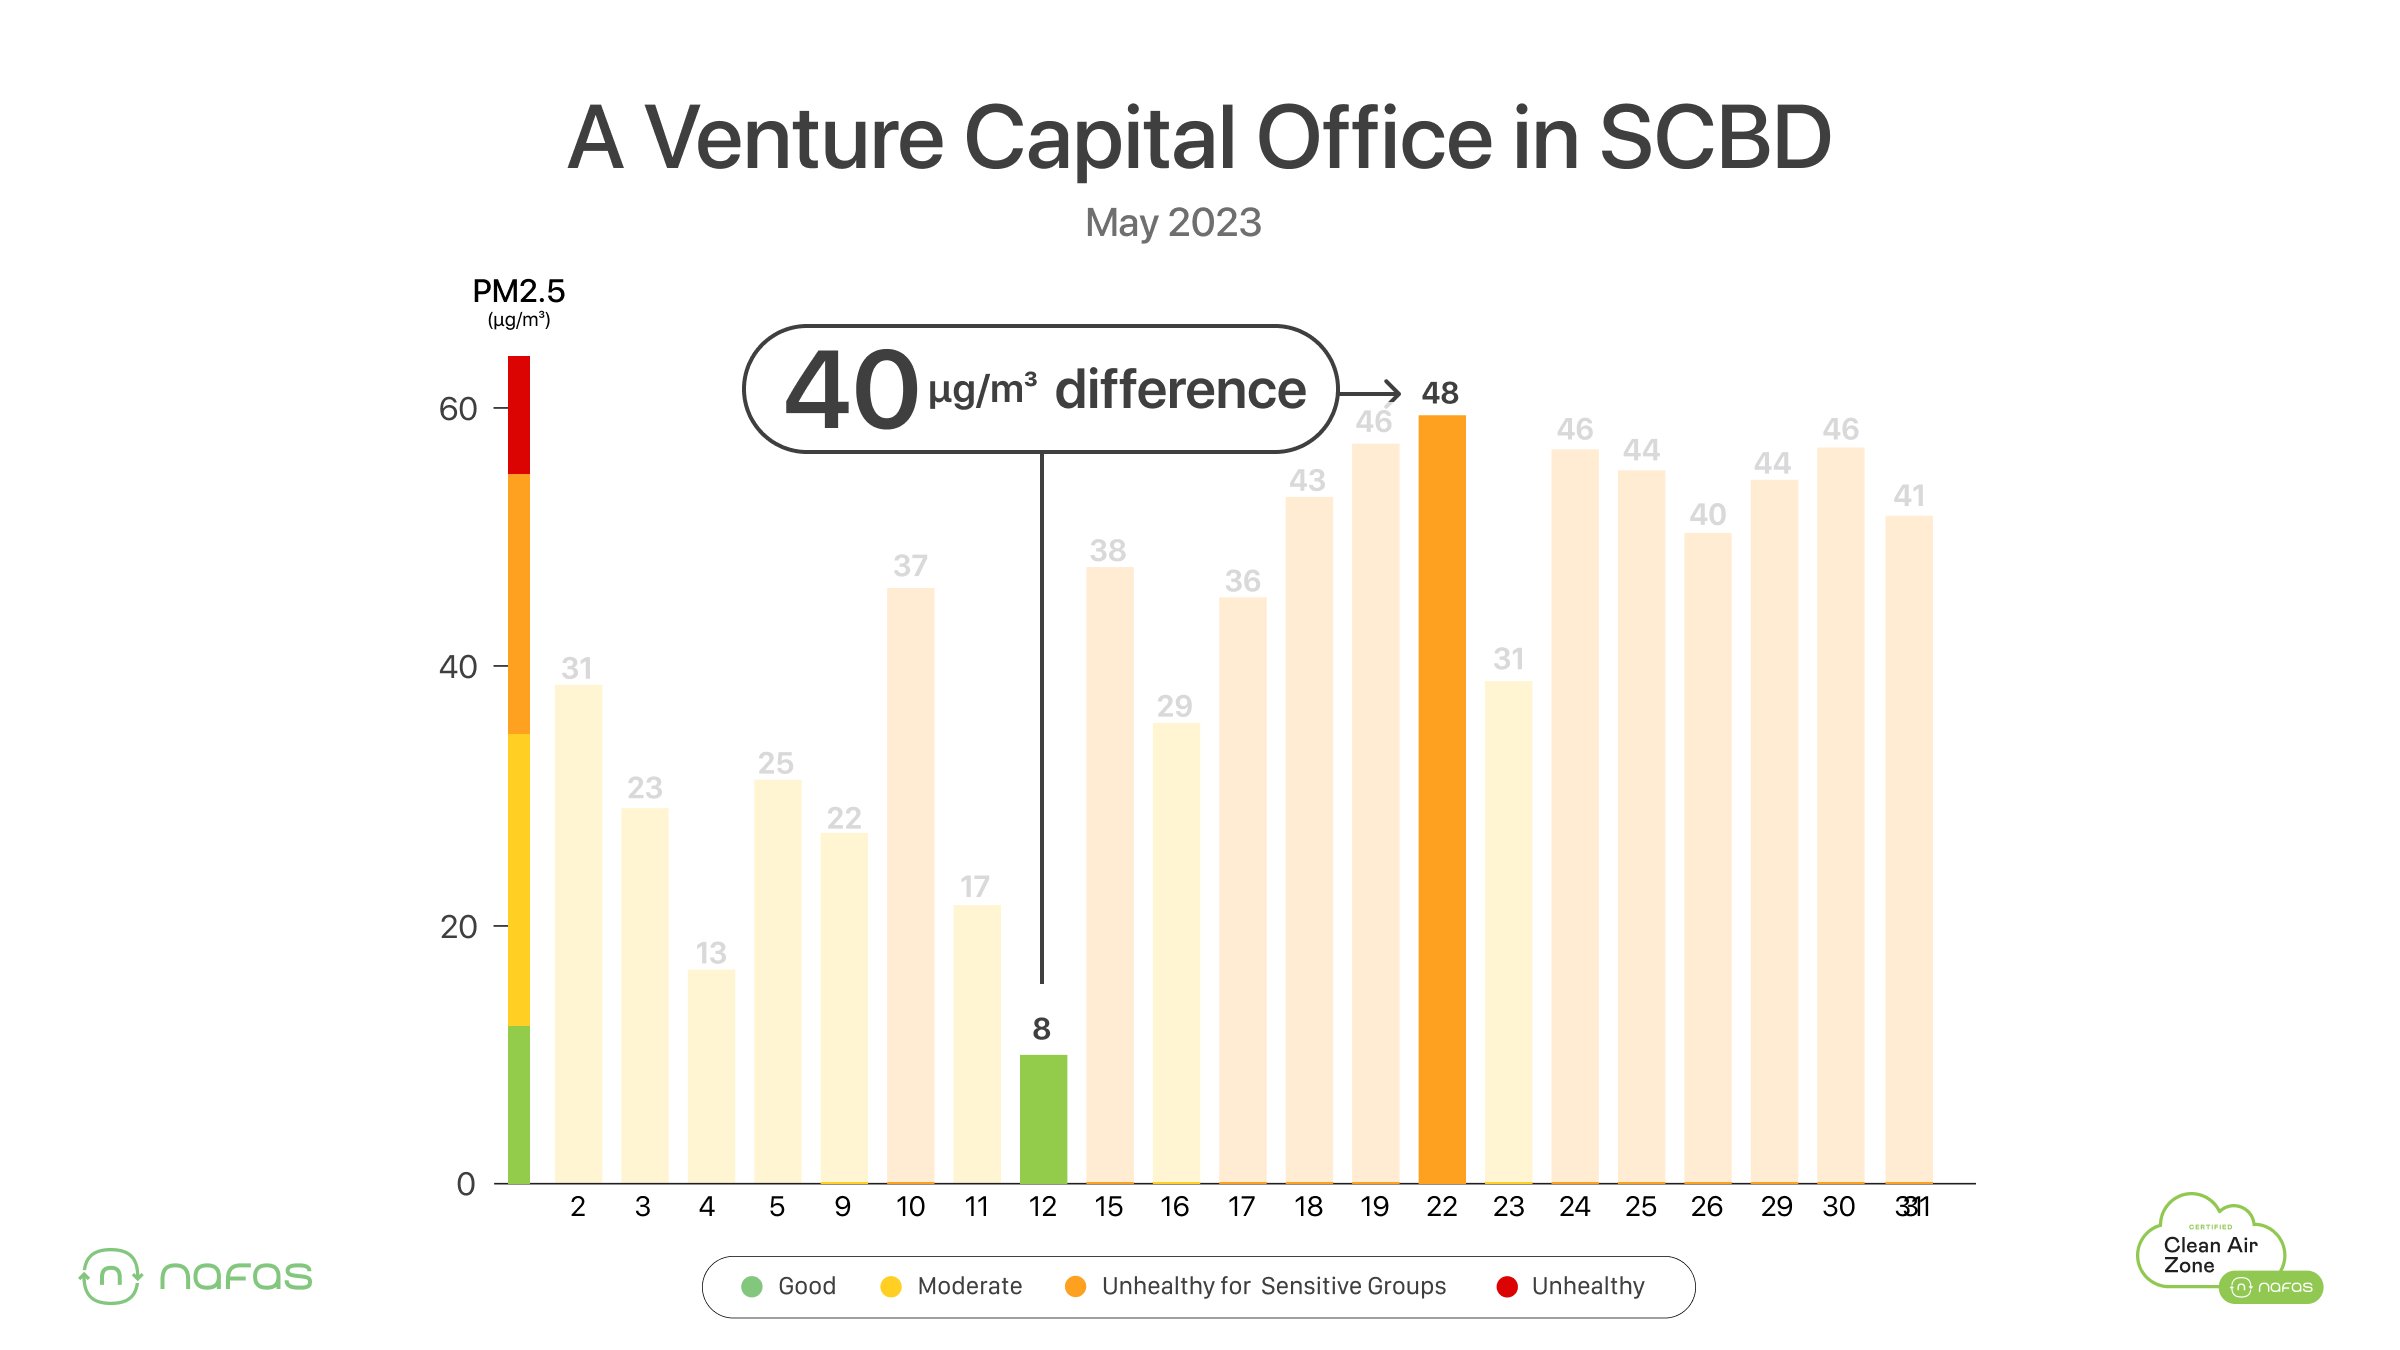
At the lowest point, the PM2.5 level during business hours is 8 µg/m3 in May 2023. However, towards the 2nd half of the month we see daily averages up to 48 ug/m3, which is an increase of 40 µg/m3.
Now, we’re not saying that the probability of making a bad decision is now 105% - but the data makes you think a bit deeper about how pollution can affect our performance in the office.
Lower performance of office workers in 80% of cognitive tasks due to high air pollution?
The CogFX study, conducted by the Harvard Healthy Buildings Program, aimed to understand the effects of indoor air pollution, including PM2.5, on cognitive performance. The study involved office workers from Thailand, India, China, US, UK and Mexico who performed a variety of cognitive tasks in their work environments.
The study discovered that office workers performed worse in 80% of cognitive tasks when PM2.5 levels were above 12 µg/m3.
“The world is rightly focused on COVID-19, and strategies like better ventilation and filtration are key to slowing infectious disease transmission indoors.”
— Dr. Joseph Allen, Founder of the Harvard Healthy Buildings institute at the T.C. Chan School of Public Health.
Let’s take a look at the air quality data from two offices in Jakarta to visualize what Dr. Allen’s research would look like in the city.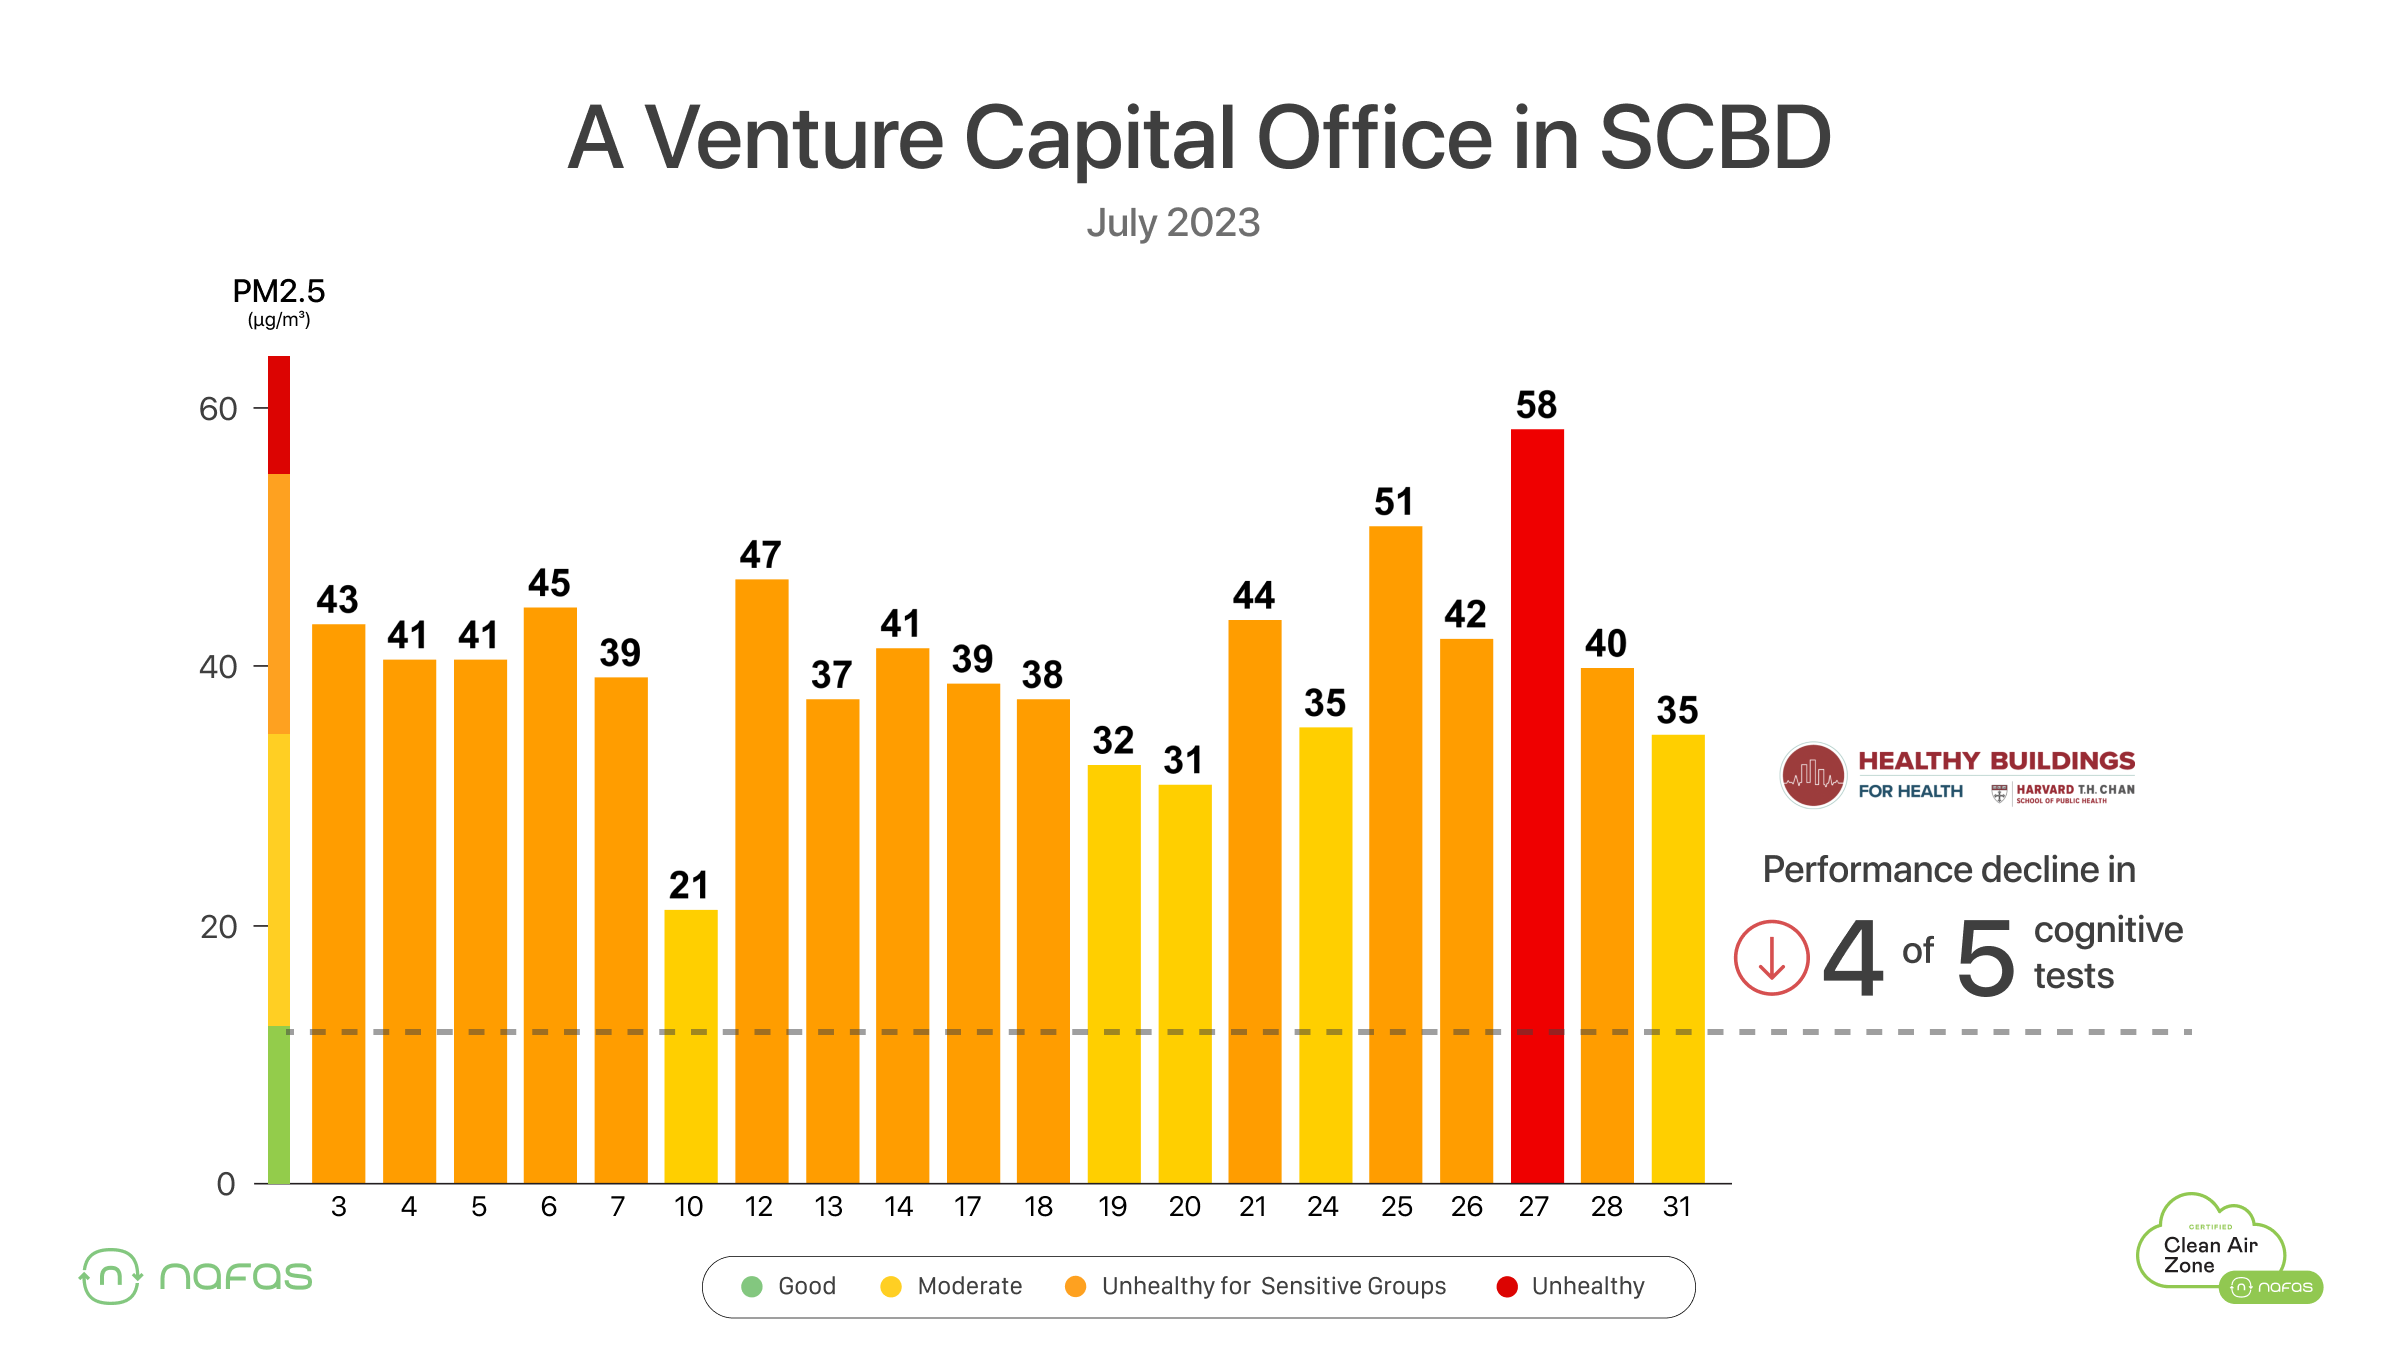
The first is our Venture Capital office in SCBD - the same one we used for the chess comparison. This time, we’re looking at data from July 2023 and there’s a big problem - the air quality.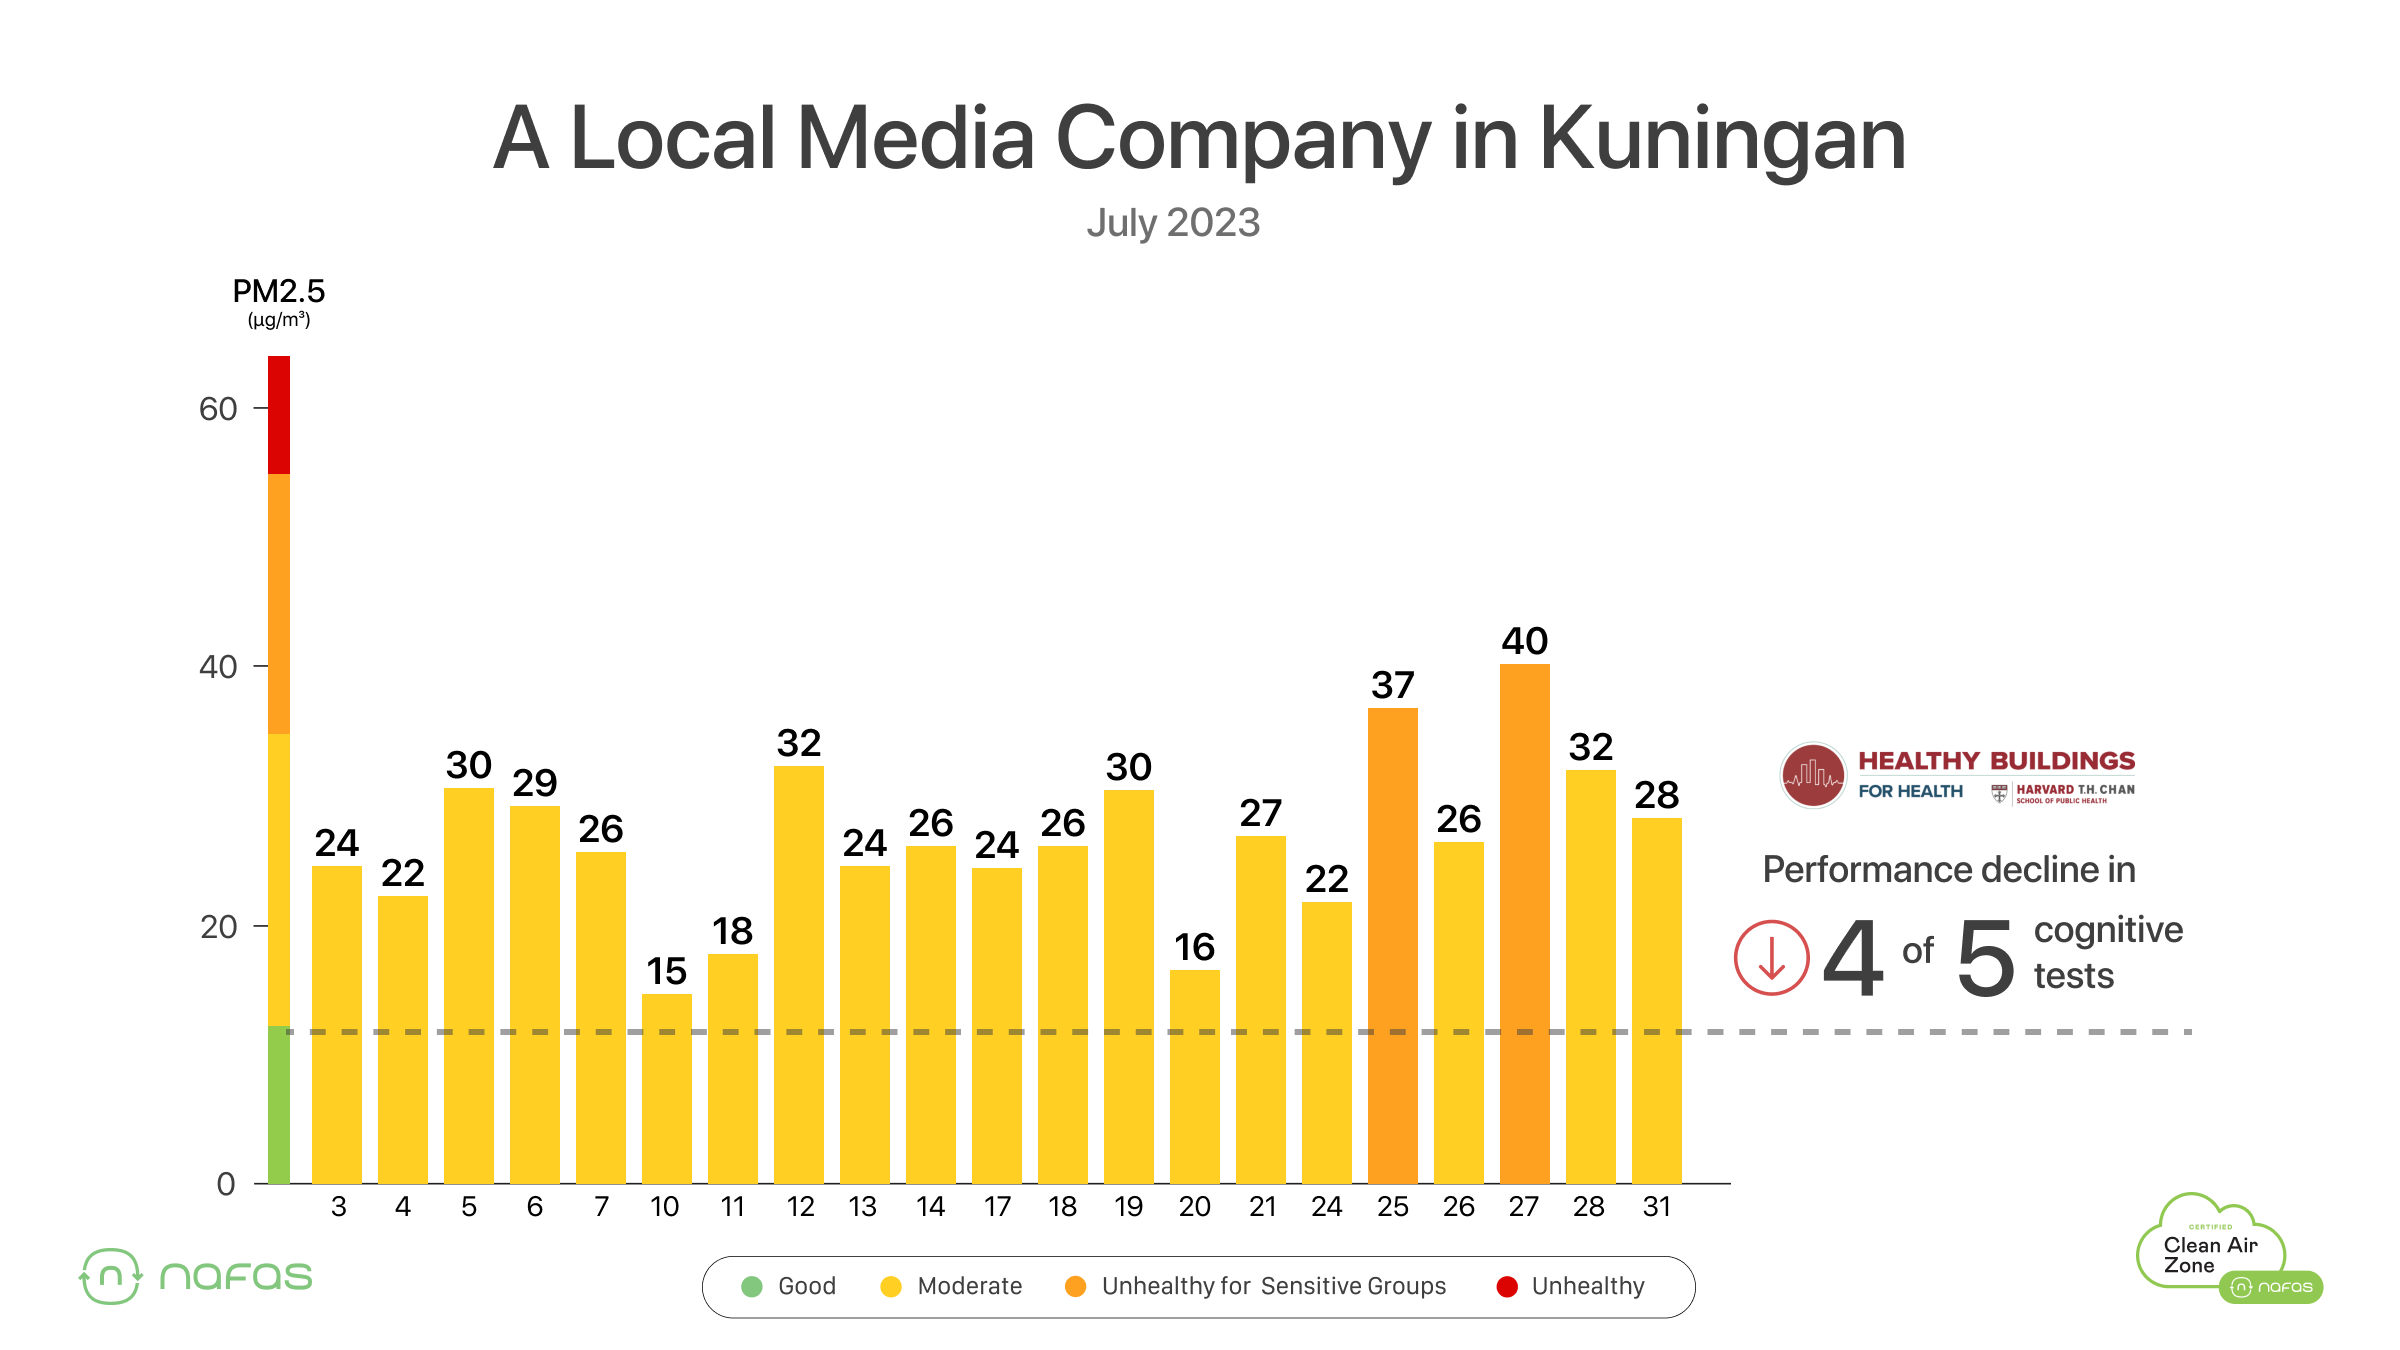
An office in the Kuningan area of Jakarta - indoor air quality during business hours far exceeds the threshold from the CogFX study.
Exposure to PM2.5 can reduce productivity by 6% or more?
A study from USC in 2016 focused on the impact of PM2.5 on productivity and decision-making in factory settings, identifying how a decrease in air quality inside a pear-packing facility drove workers to earn less money.
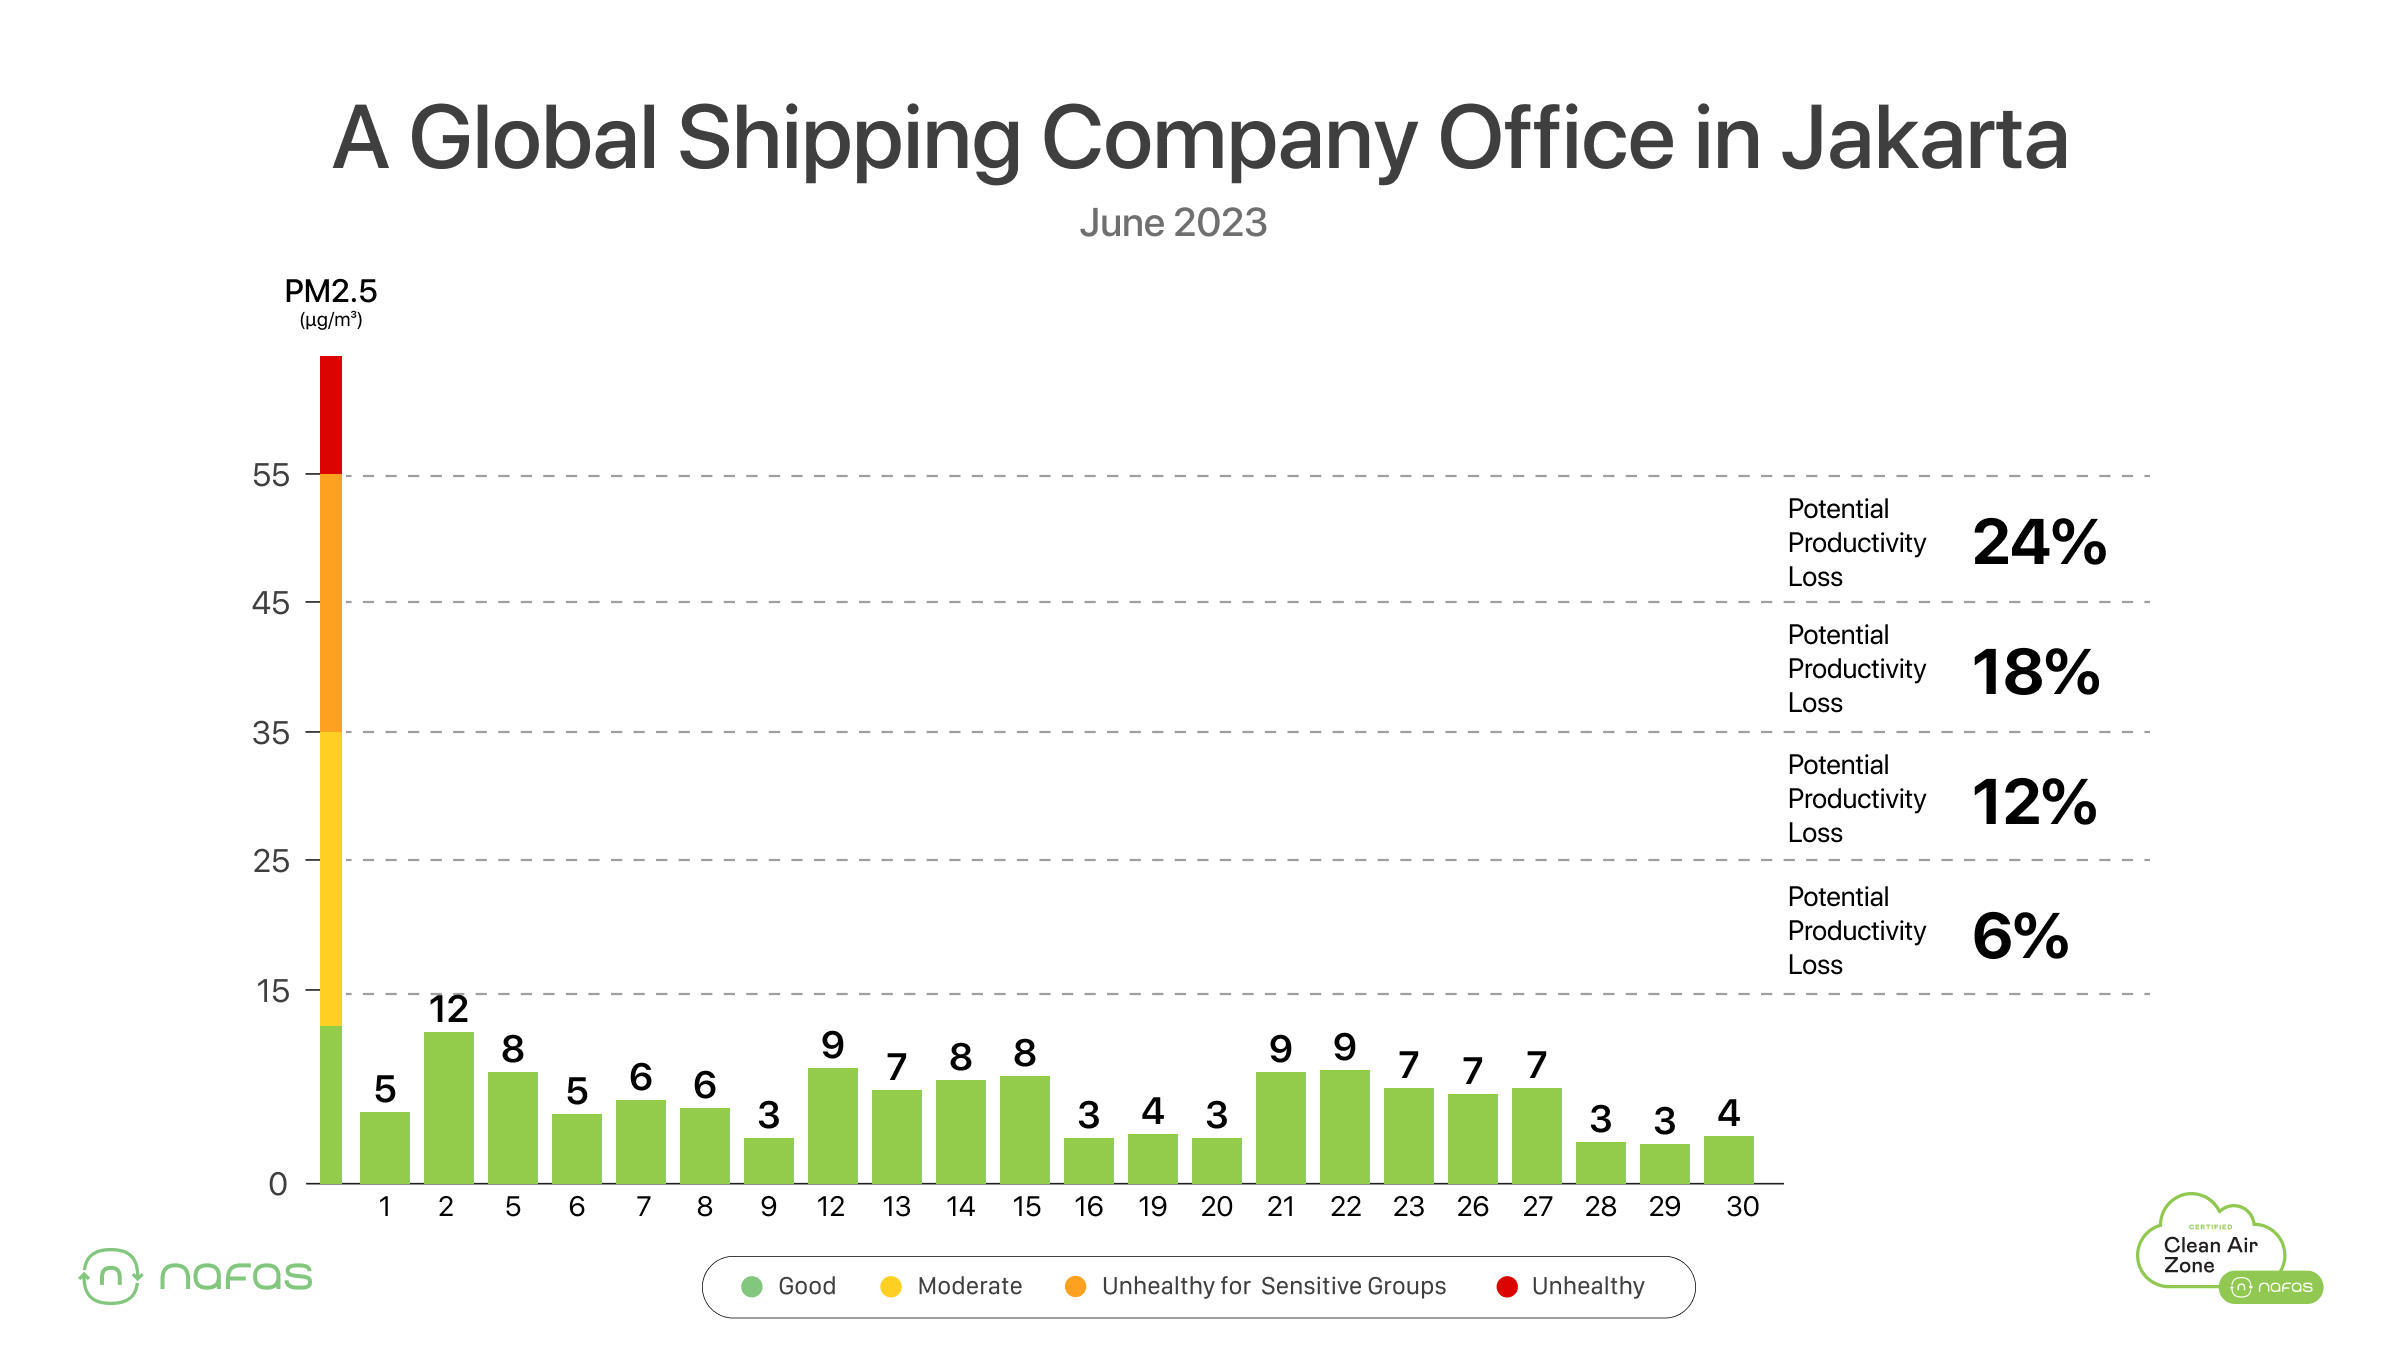
They discovered that each time PM2.5 increased by 10 µg/m3 above a baseline of 15 µg/m3, productivity would decline by 6%. An office in the SCBD area of Jakarta - indoor air quality during business hours in June 2023 far exceeds the various thresholds of productivity loss highlighted in the USC study.
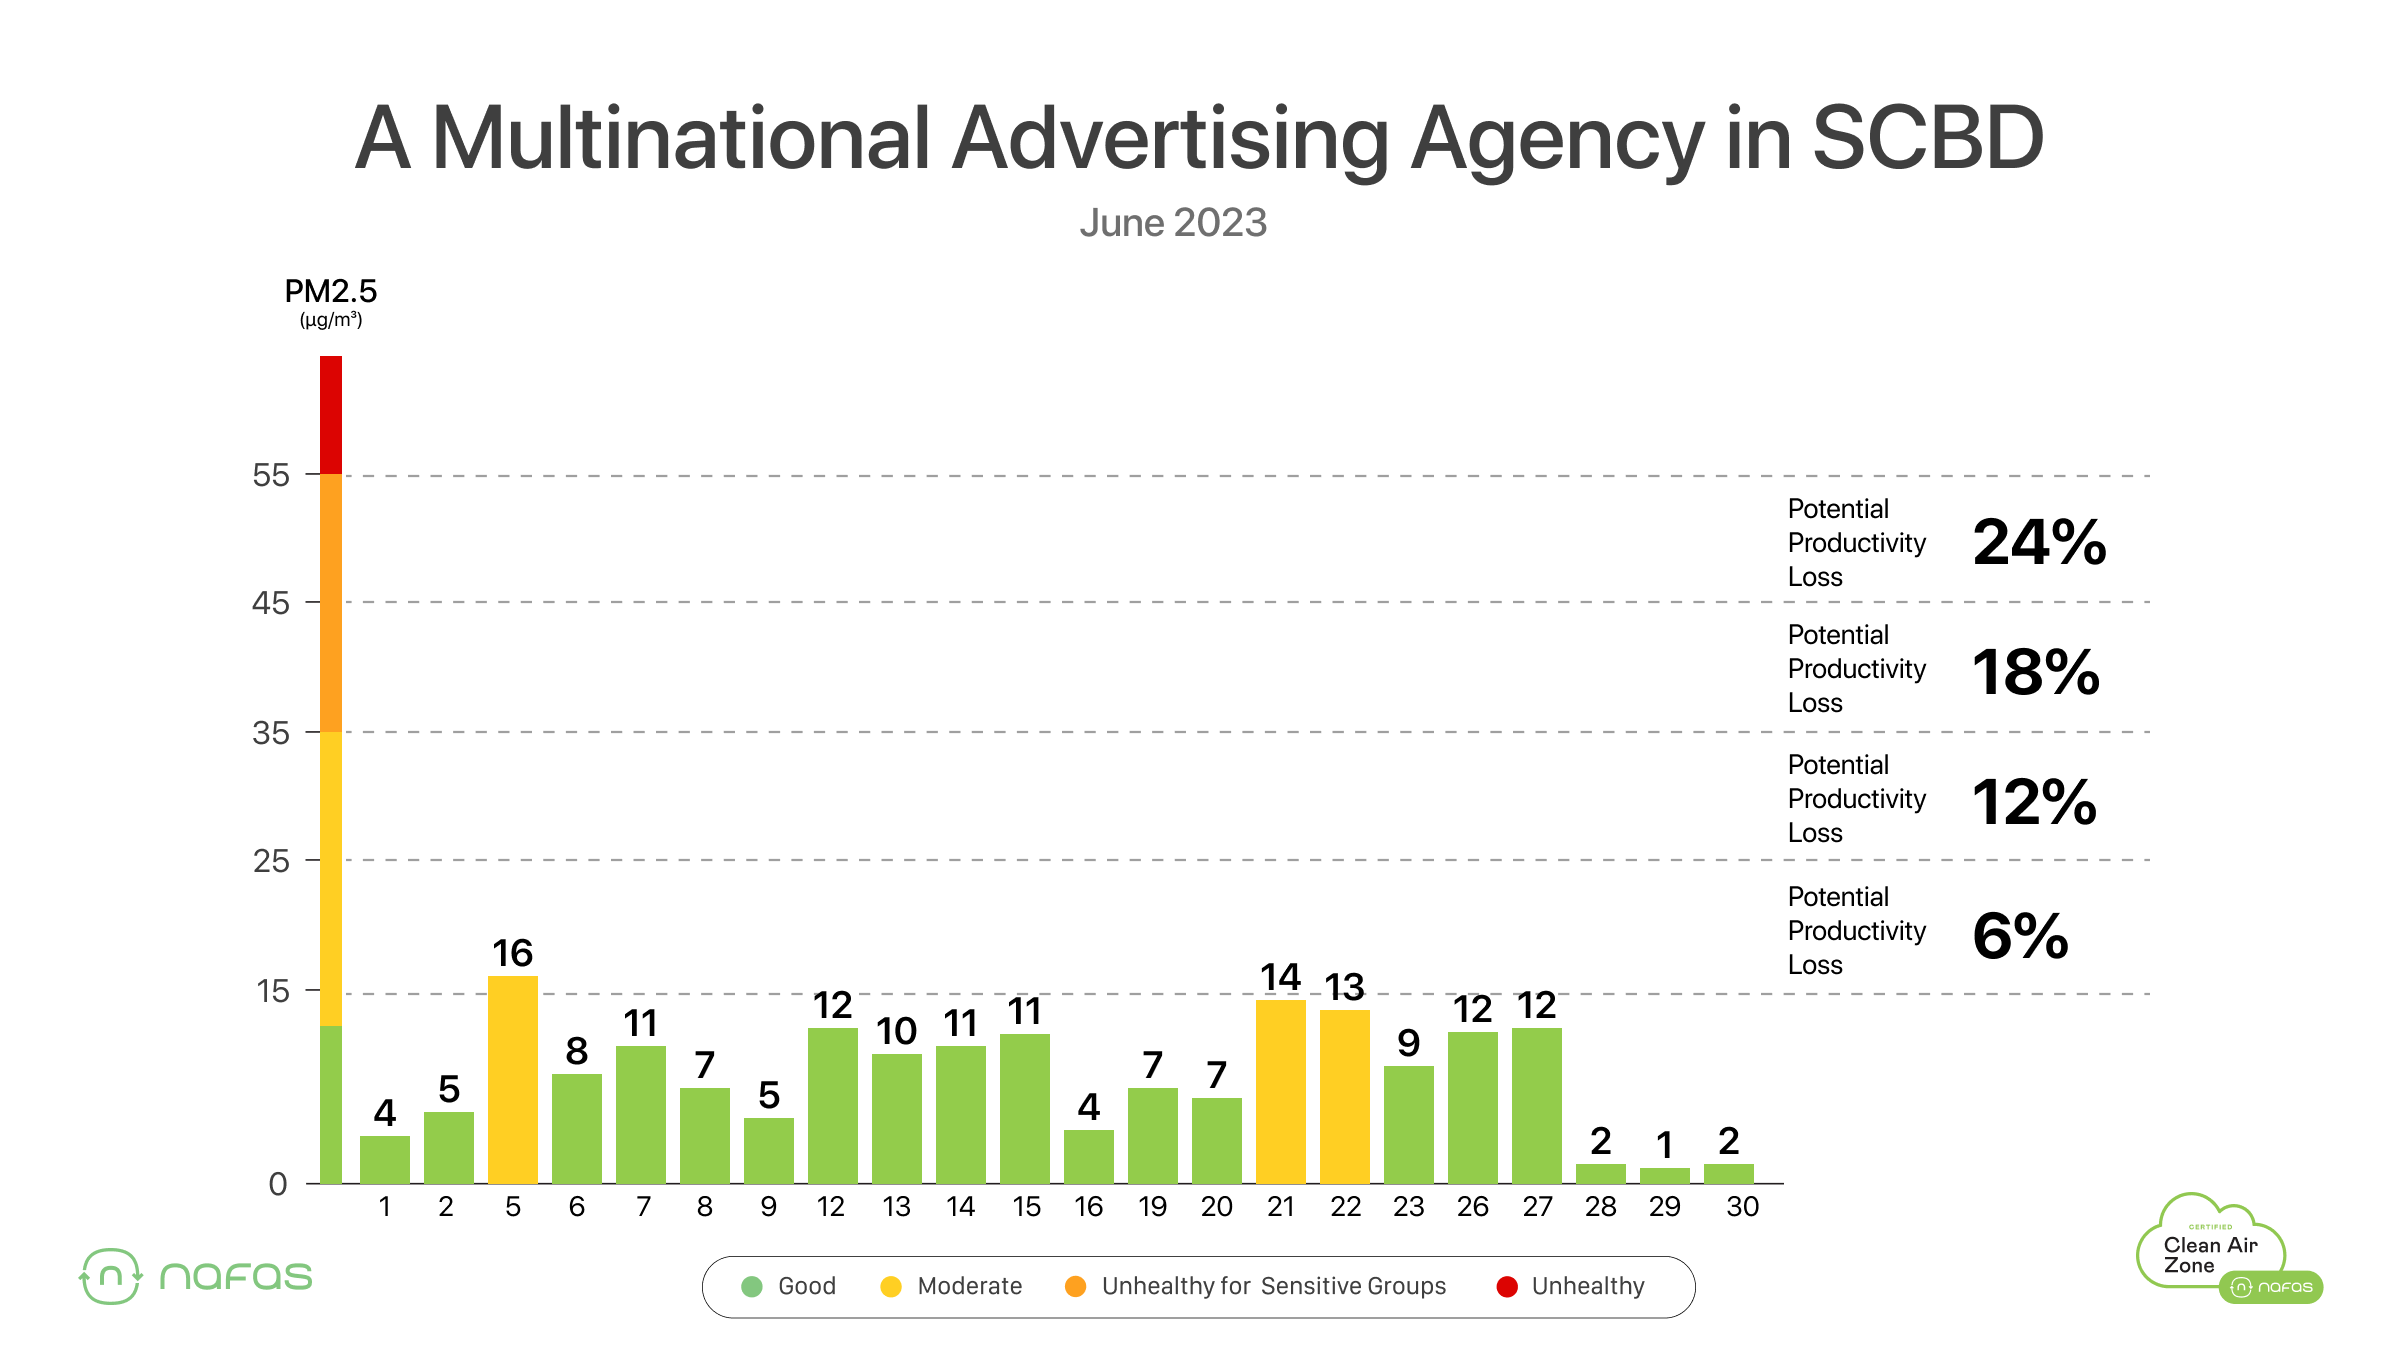
Let’s take a look at another office: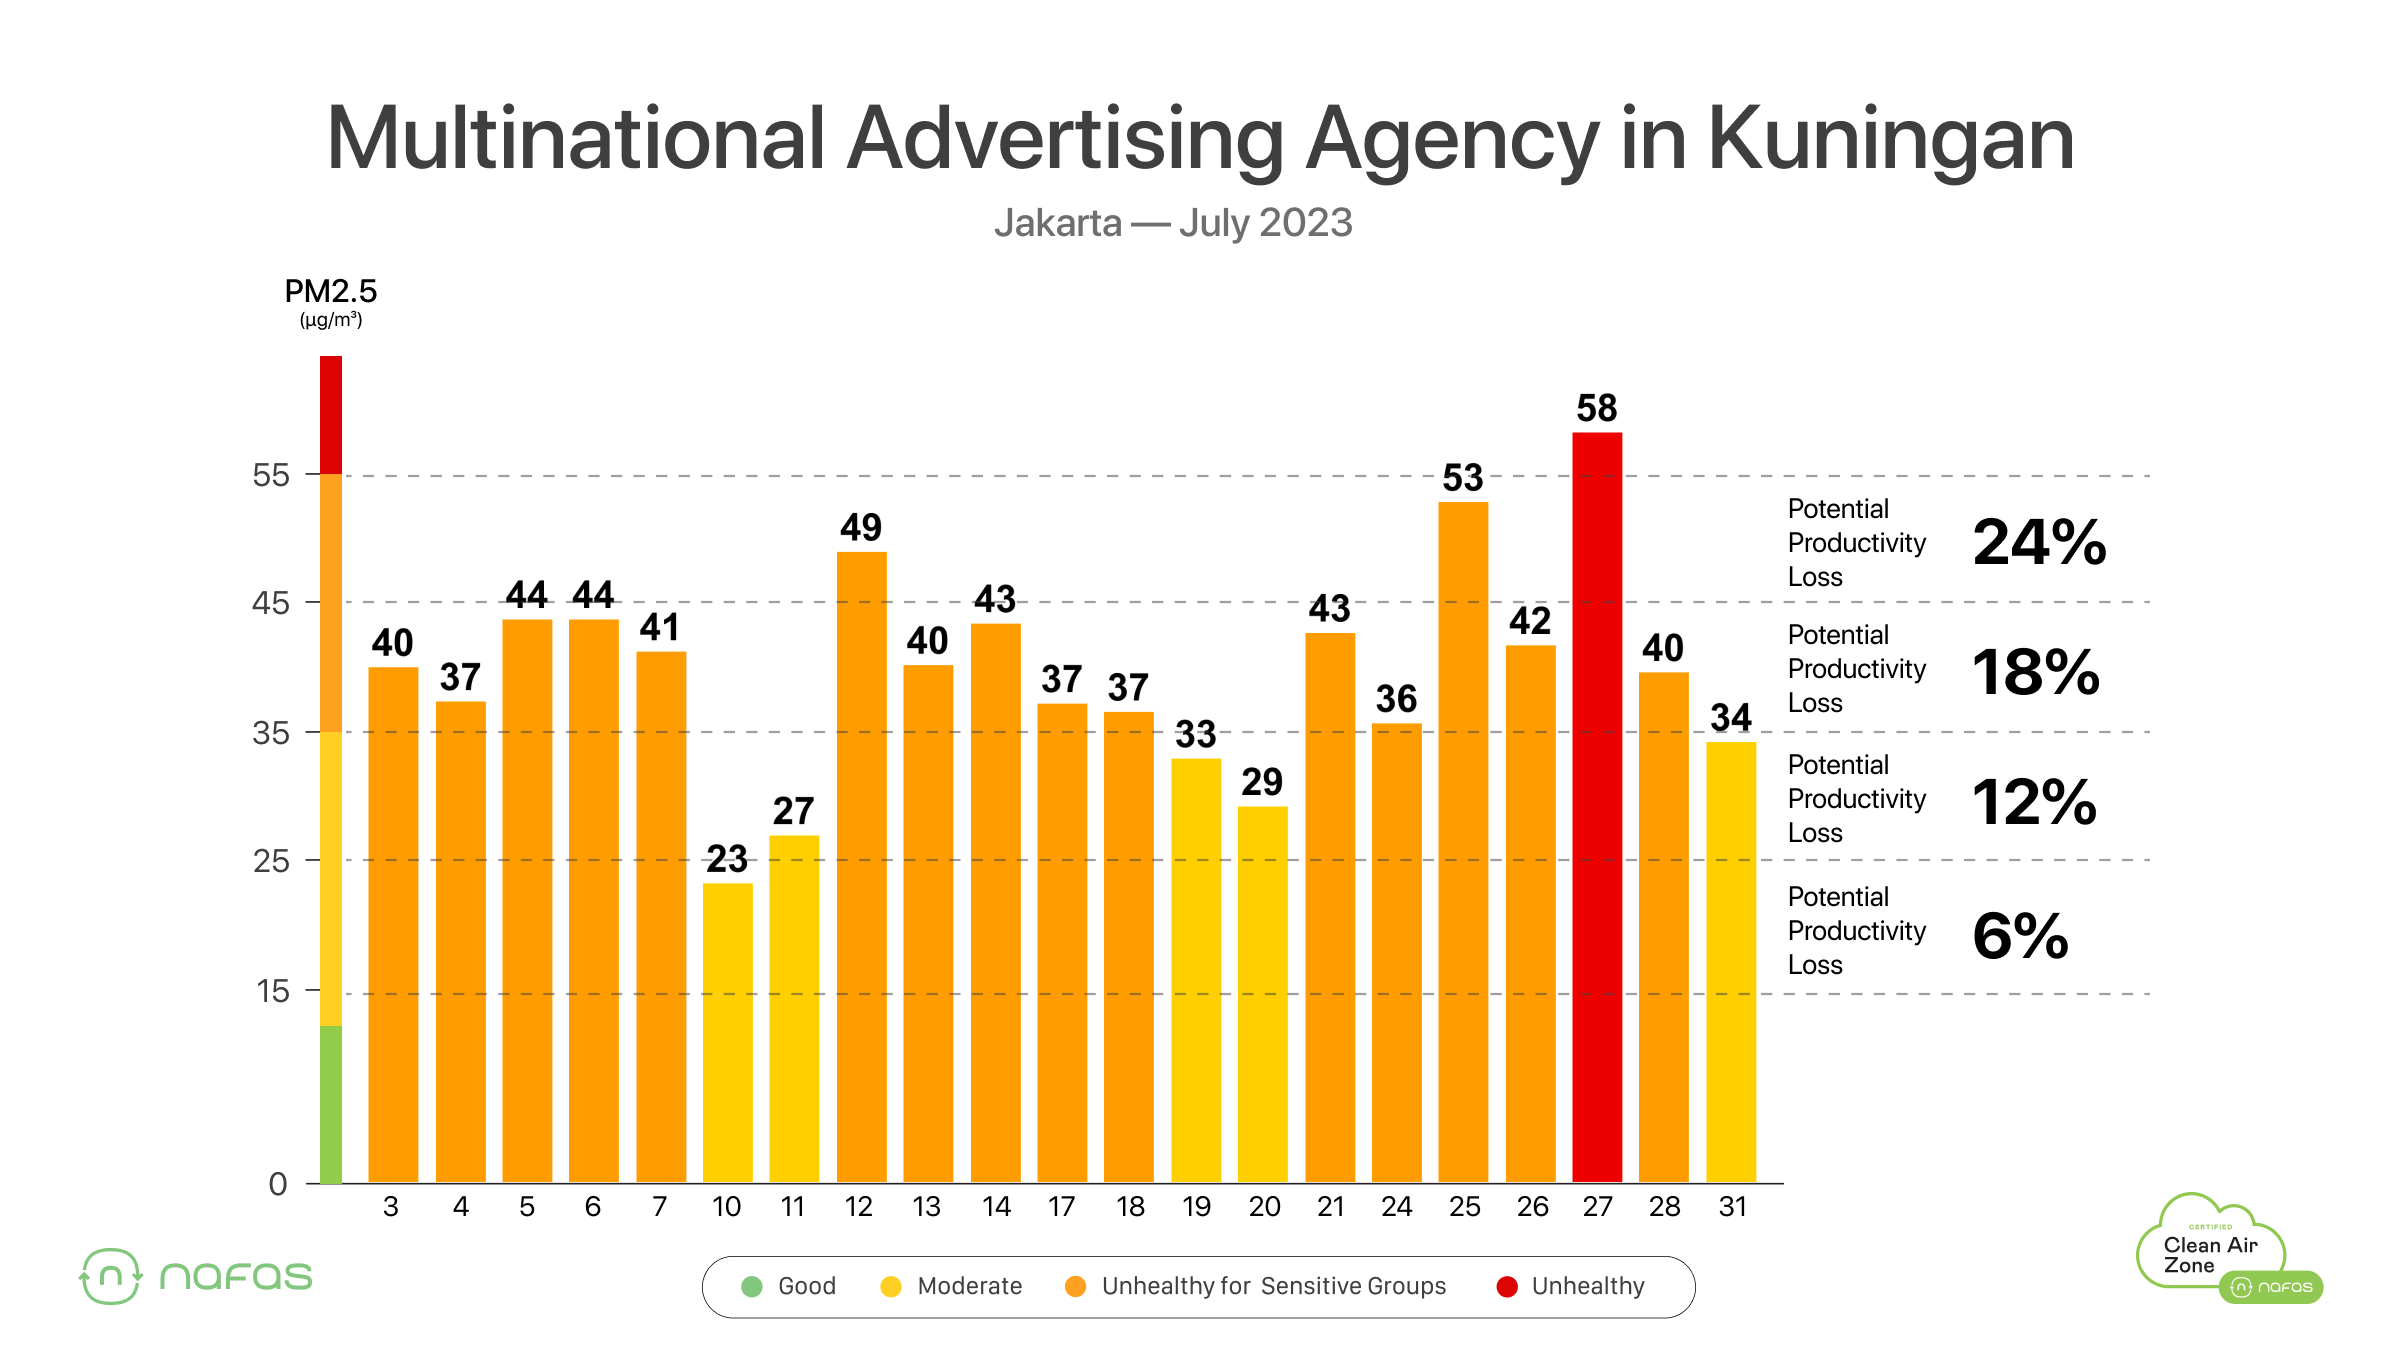
This is a multinational advertising agency with an office in Kuningan. We can see very clearly that the indoor air quality in June 2023 could potentially contribute to productivity loss within the company.
So, what should air quality look like inside these offices?
What indoor air quality at the office SHOULD look like
Both the Harvard and USC studies highlighted an impact in performance or productivity above indoor PM2.5 levels of 12 µg/m3 and 15 µg/m3 - coincidentally, these are considered “Good” in the US EPA and ISPU scales.
In order to achieve this in cities where pollution is high - like Jakarta, Bandung or Surabaya - buildings need to implement enhanced filtration strategies.
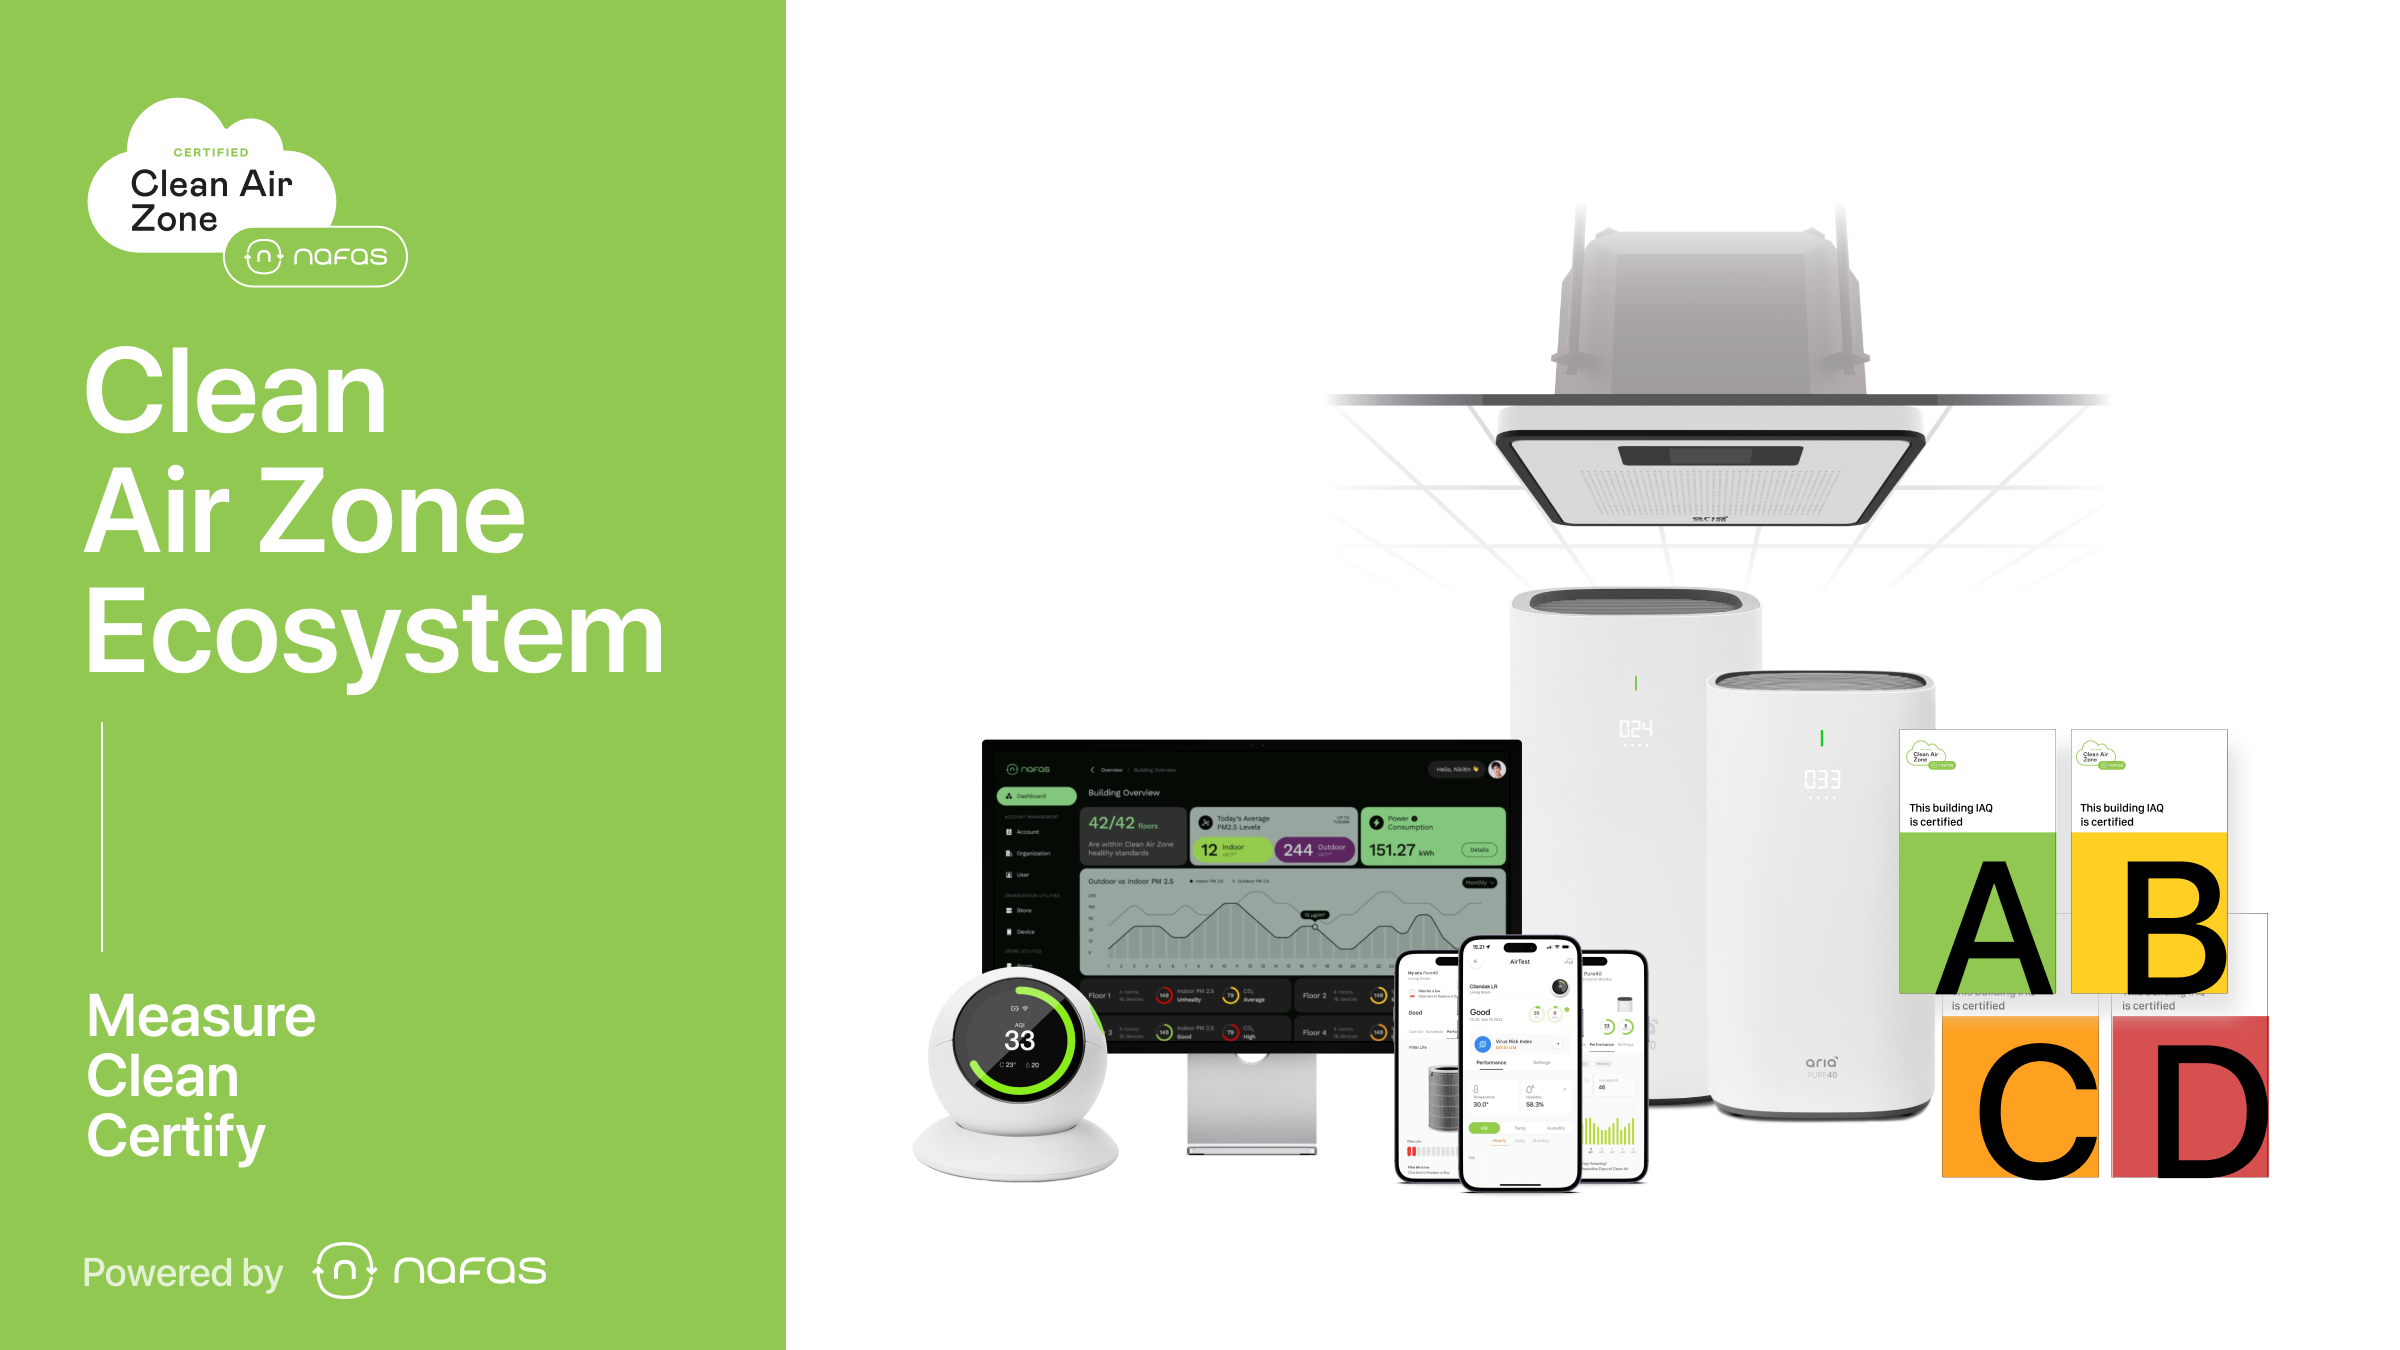
That’s why Nafas has created a subscription service called Clean Air Zones - to bring your business or your building healthy air quality without having to think about it. Through years of development, Nafas has designed an ecosystem that helps companies measure their air pollution levels in their offices, fix the problem, receive a certification and submit as part of their ESG reporting on platforms such as GRI, MSCI, Sustainlytics, Moody’s and many others.
Becoming a Clean Air Zone takes 3 easy steps
1. Nafas conducts a diagnostic and each location receives an AirScore
2. Based on the AirScore, Nafas provides a plan of action & subscription proposal
3. Nafas installs automated healthy air ecosystem, performs calibrations and makes the data available on a personalized dashboard.
And the best part?
We do everything for you.
Want to see what the results look like? Here’s 3 offices which have been turned into Clean Air Zone.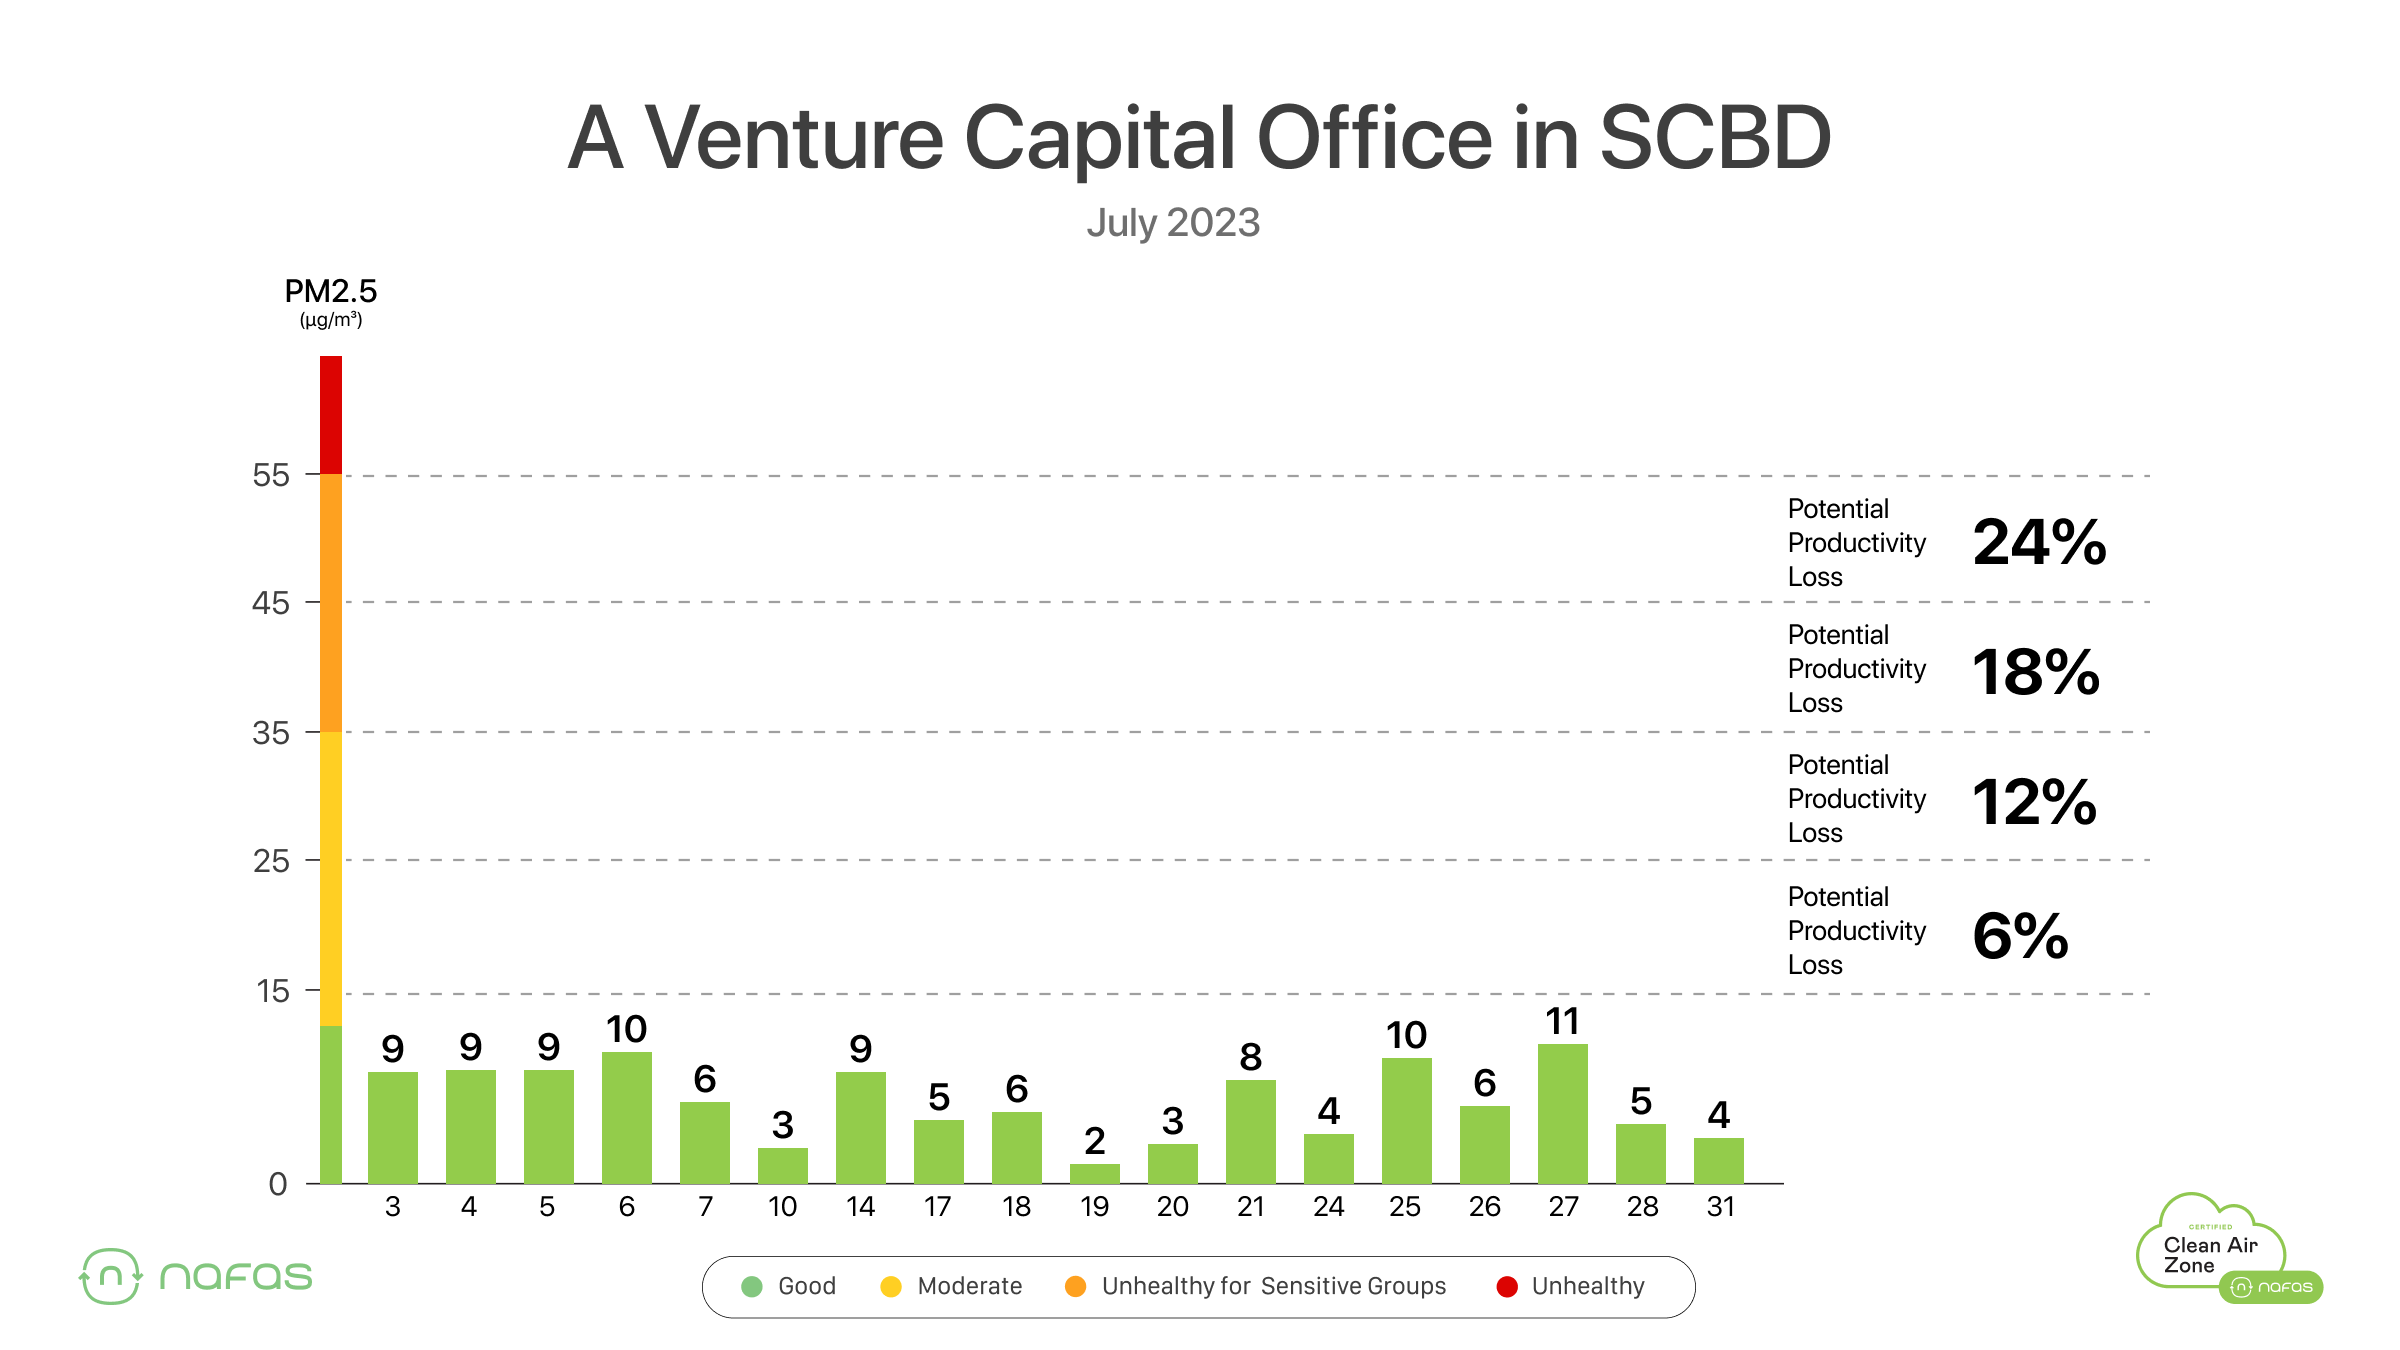
Becoming a Clean Air Zone is So Easy
Interested in ensuring healthy air quality in your office at all times? Feel free to contact us at [email protected] or click the link below. Let's join our mission to make clean air the standard in our offices!