Nafas AQ Championship 2022’s Finals: We found the champion!
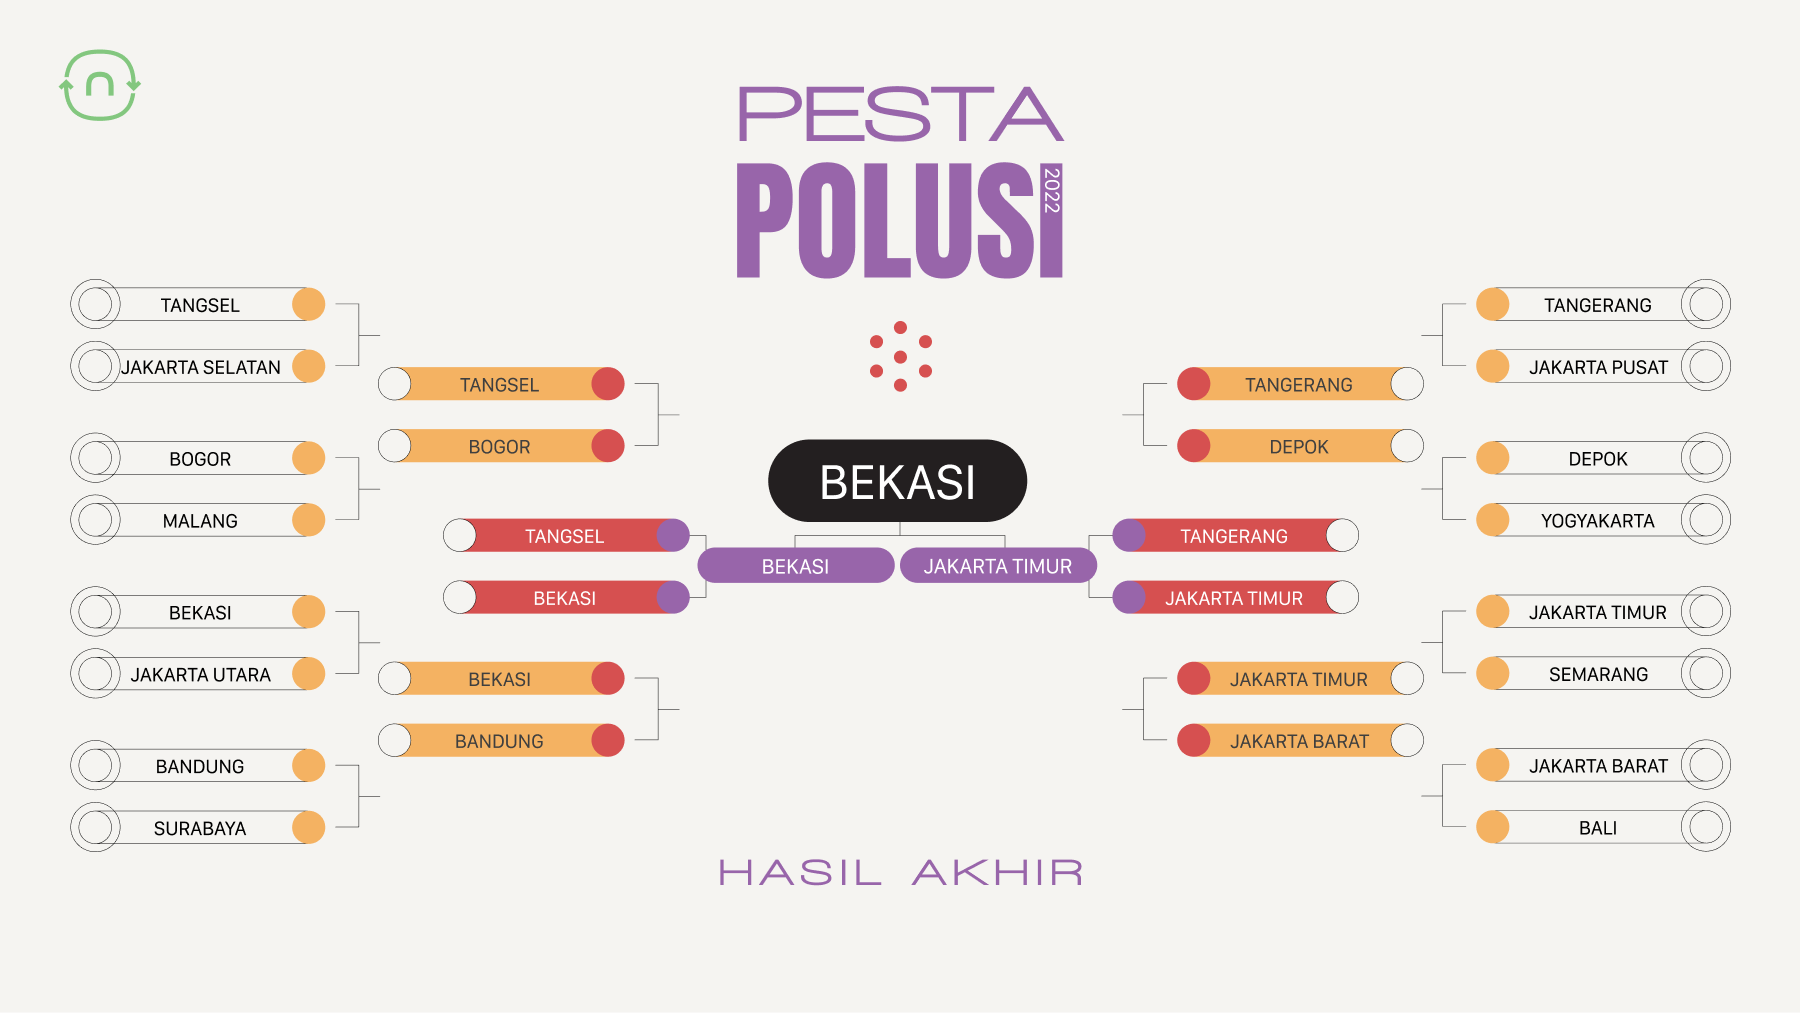
Nafas Air Quality Championship 2022 (Pollution Party) that involved 16 regions in Java and Bali has reached the final. Bekasi had successfully defeated East Jakarta in the final round and became the champion as the most polluted region out of 16 regions.
During the competition, nafas used real-time air quality data that were recorded through 180+ sensors among Java and Bali. From the qualification up to the semifinal round, nafas used air quality data from June - August 2022 as it was considered the “bad air season” of the year. And for the final round we used the most recent data from 1-14 December to select the winner.
Nafas had discovered a lot of pivotal findings throughout the competition. Aside from the fact that Indonesia air quality hasn’t been showing significant improvement and is steadily deteriorating, there are five other findings that we have compiled below.
Air pollution is not just Jakarta’s problem.
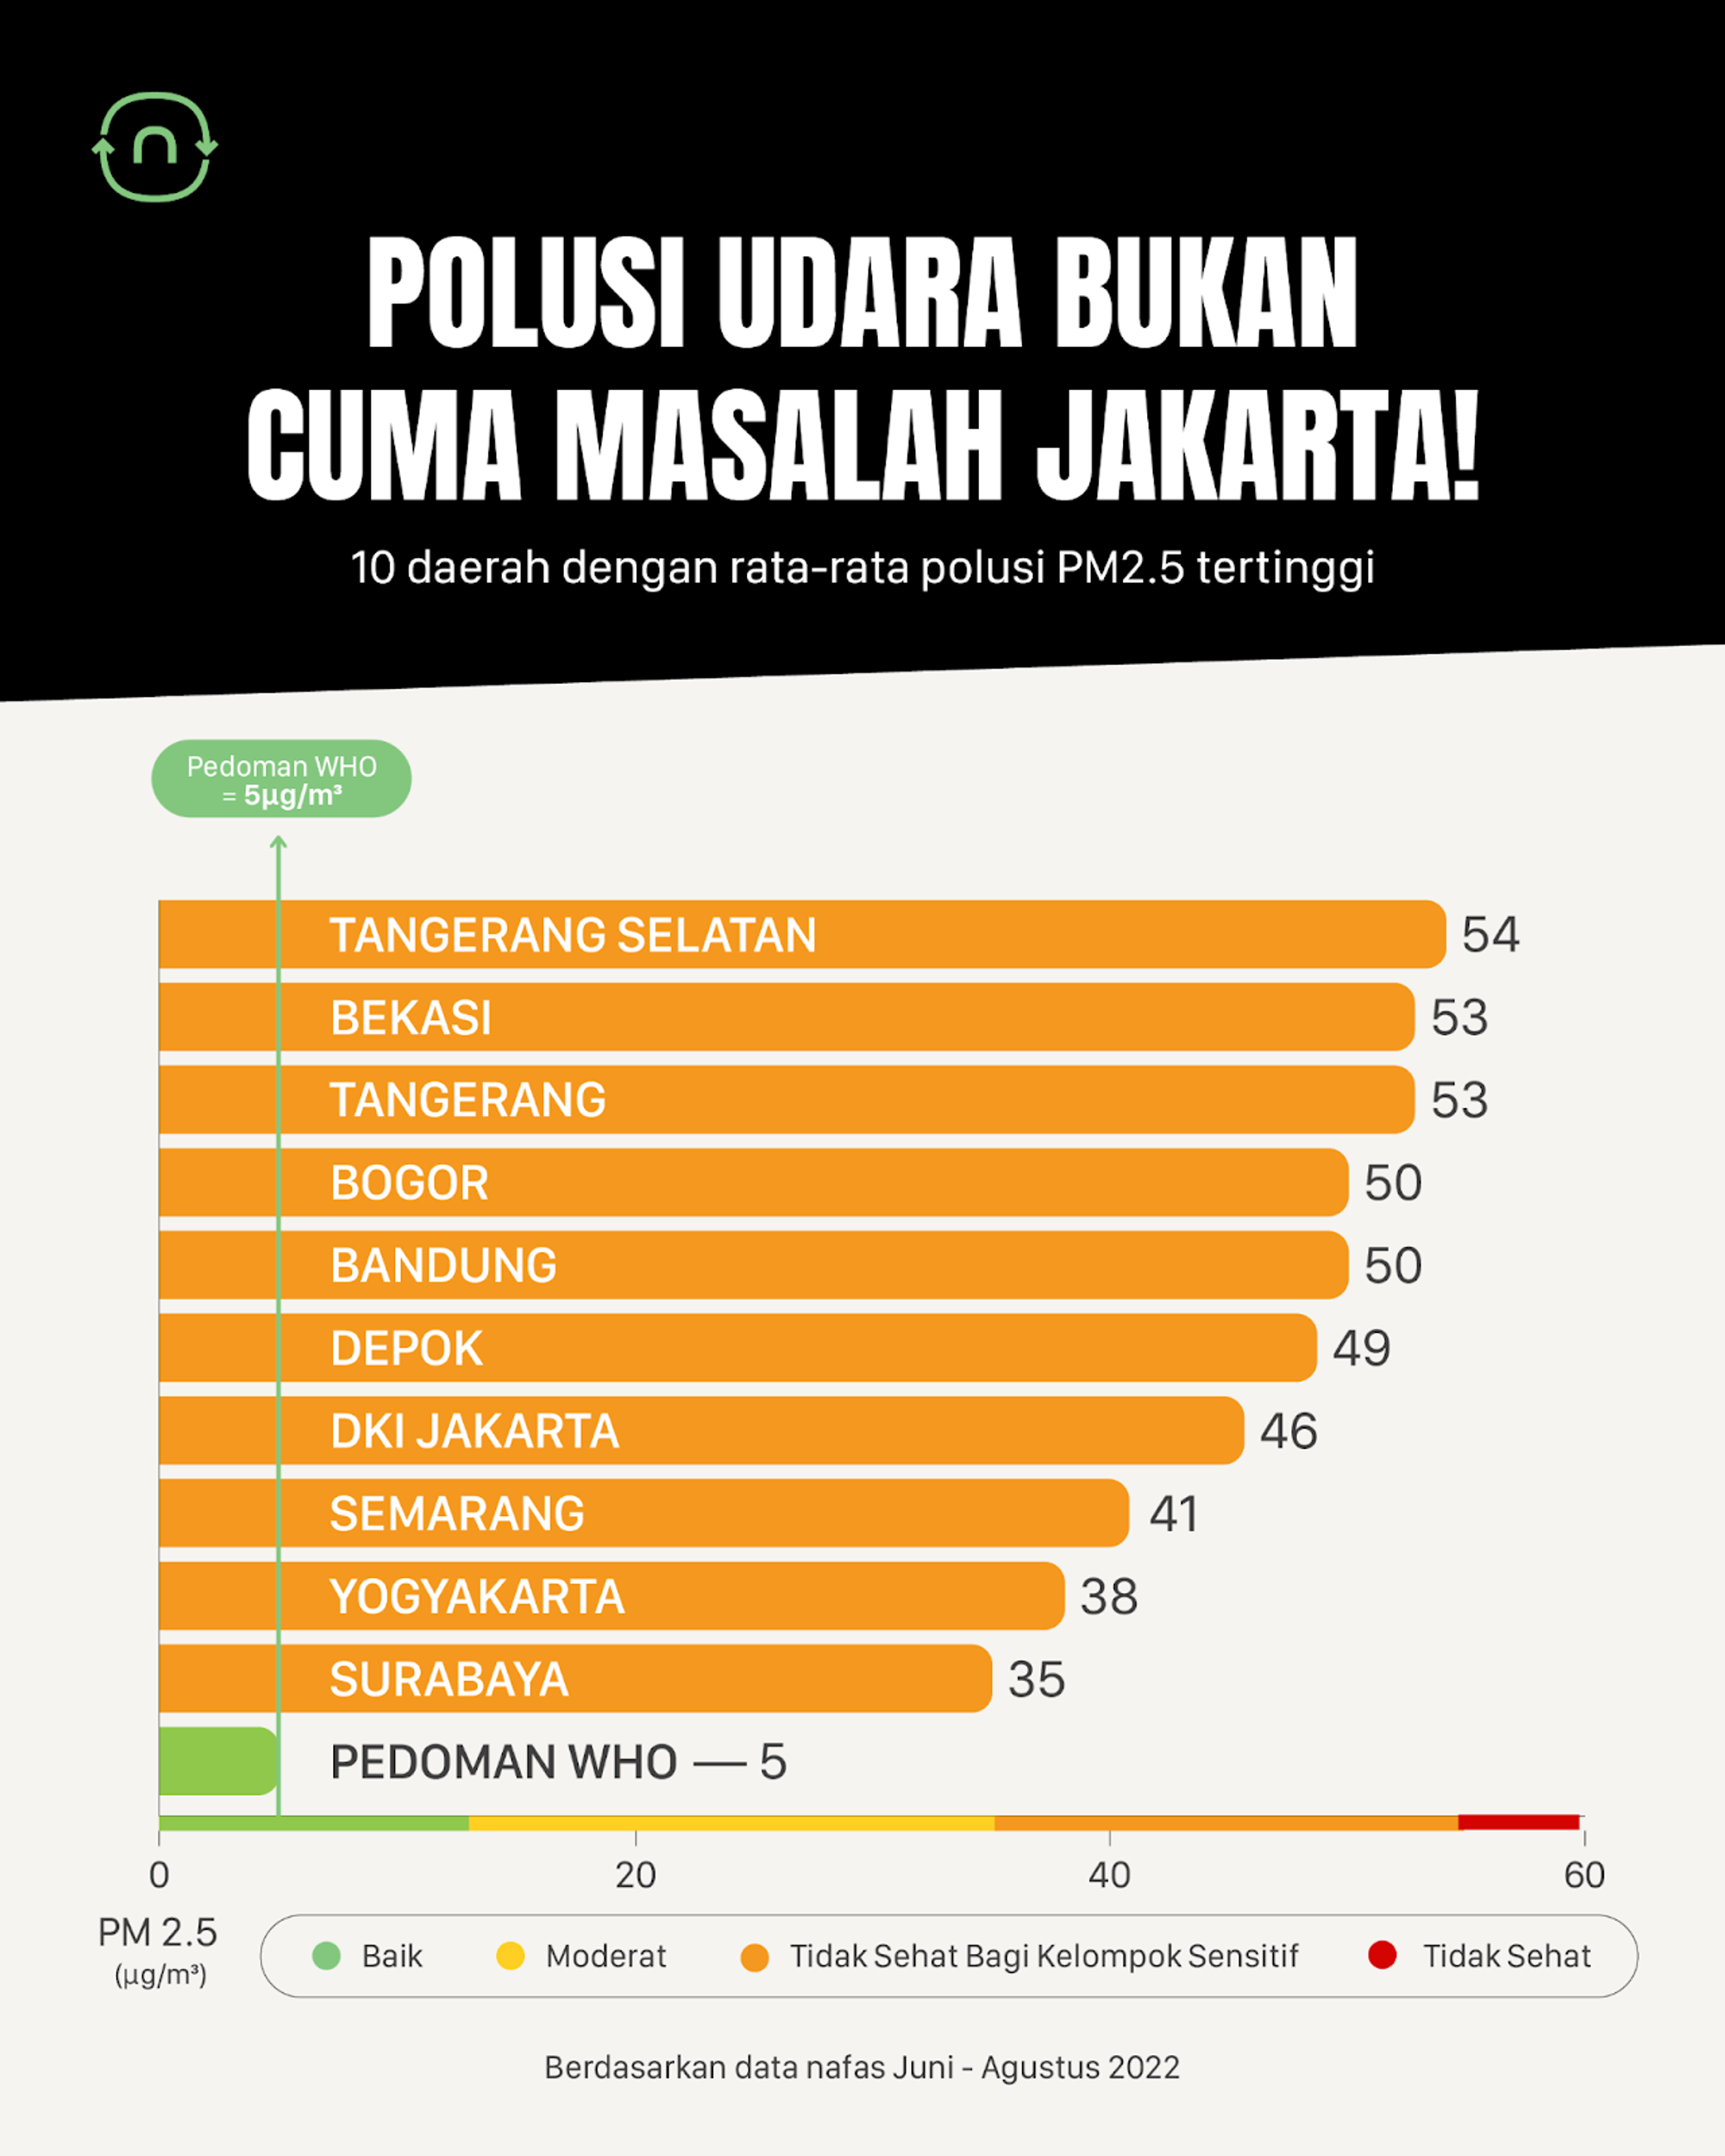
Jakarta was crowned as the most polluted city in the world in June 2021, and the headline quickly appeared on a lot of Indonesian media front pages. Jakarta air quality is indeed bad, but let’s take a look at the situation in other cities in Indonesia too.
Our team had compiled data of 10 cities with the worst air quality. We combined the whole DKI Jakarta regions in order to simplify the graph; please refer to the Pollution Party competition on our instagram page for a more in-depth review of each city in Jakarta. The graph above shows that South Tangerang, Bekasi, Tangerang, Bogor, Bandung, and Depok are above DKI Jakarta in terms of PM2.5 pollution.
Air pollution causes us to become passive smokers
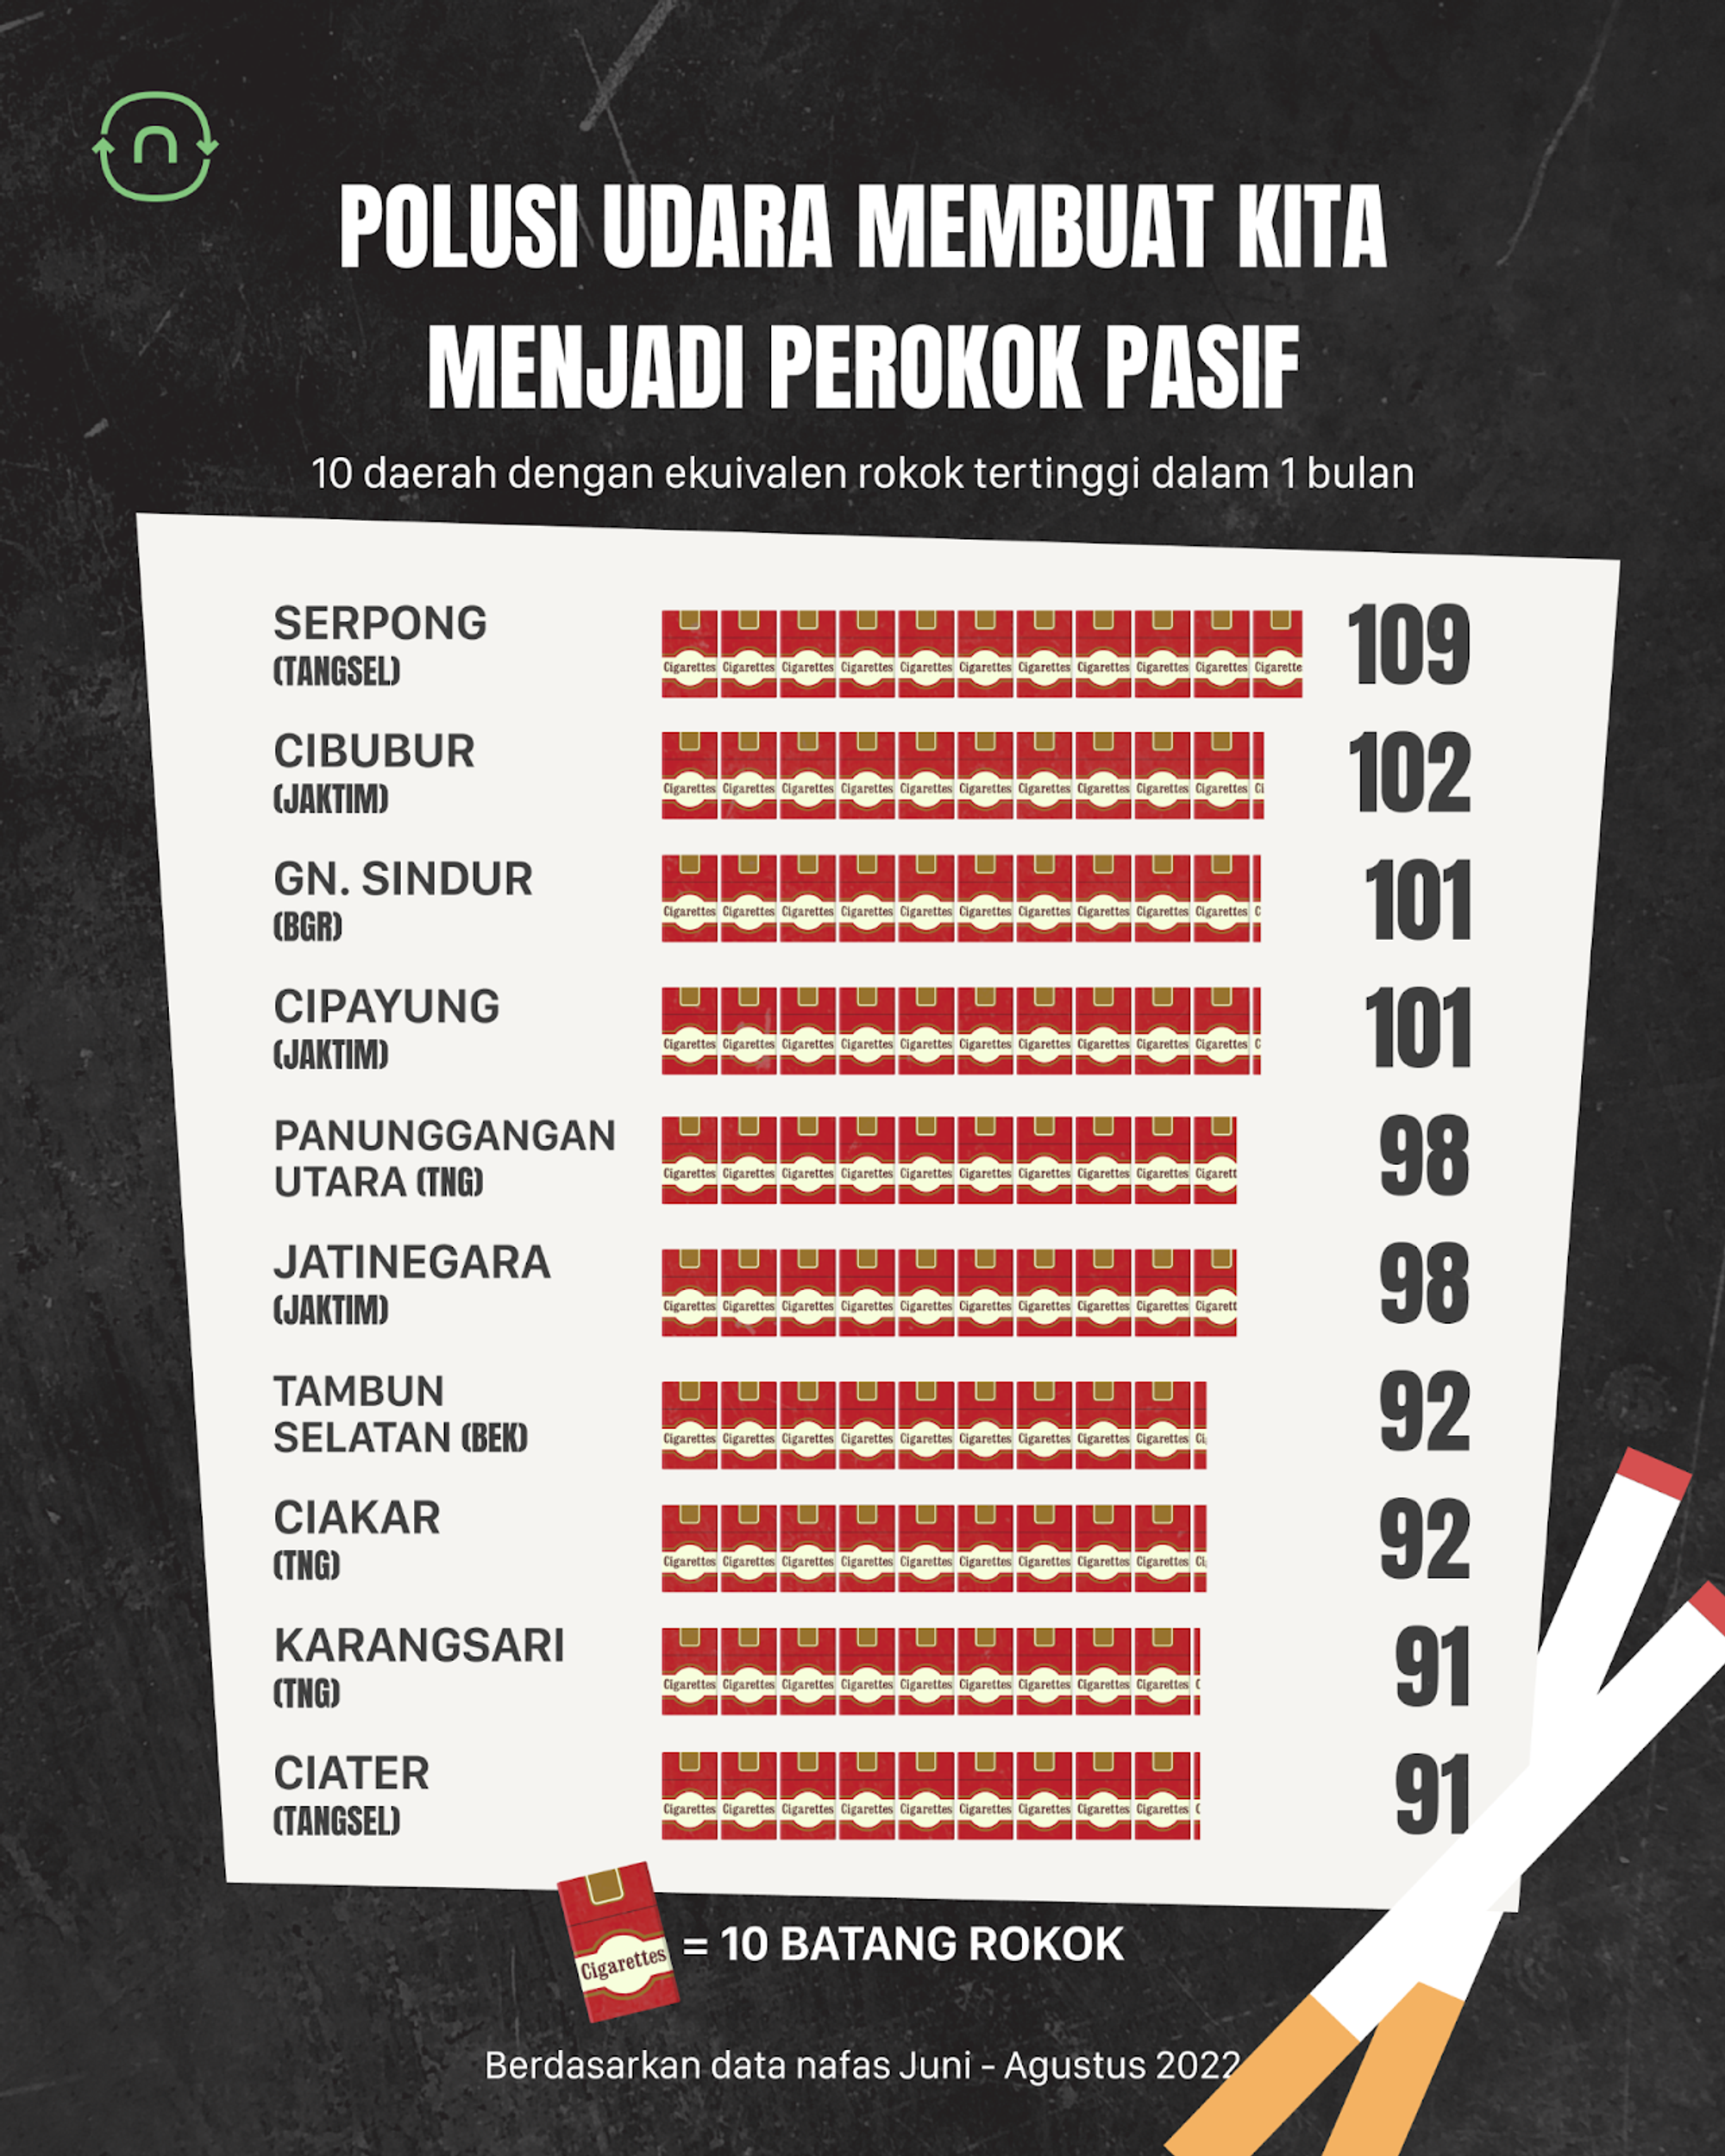
We observed the average monthly cigarette equivalence throughout June - August, and Serpong came out on top. This means, Serpong’s residents inhaled up to 109 cigarettes in a month or 3-4 cigarettes worth of polluted air each day. The situation worsened by knowing that the number of cigarettes was applied to everyone in that area; men and women, old and young. Everybody had unconsciously become a ‘smoker’ without necessarily smoking.
According to a research done at University of Bristol, 1 cigarette may decrease life expectancy up to 11 minutes. If we take the current state of air quality into perspective, the residents of Serpong had lost (109 cigarettes x 11 minutes) 1,199 minutes or 20 hours in a month.
Based on the data above, it is observed that Tangerang is in a similar predicament. When the total of ‘cigarettes smoked’ in Karangsari, Ciakar and Panunggangan Utara are combined, we found that Tangerang’s residents ‘smoke’ 245 cigarettes in June - August 2022.
During the bad air season, there wasn’t any area with “green” or healthy air quality
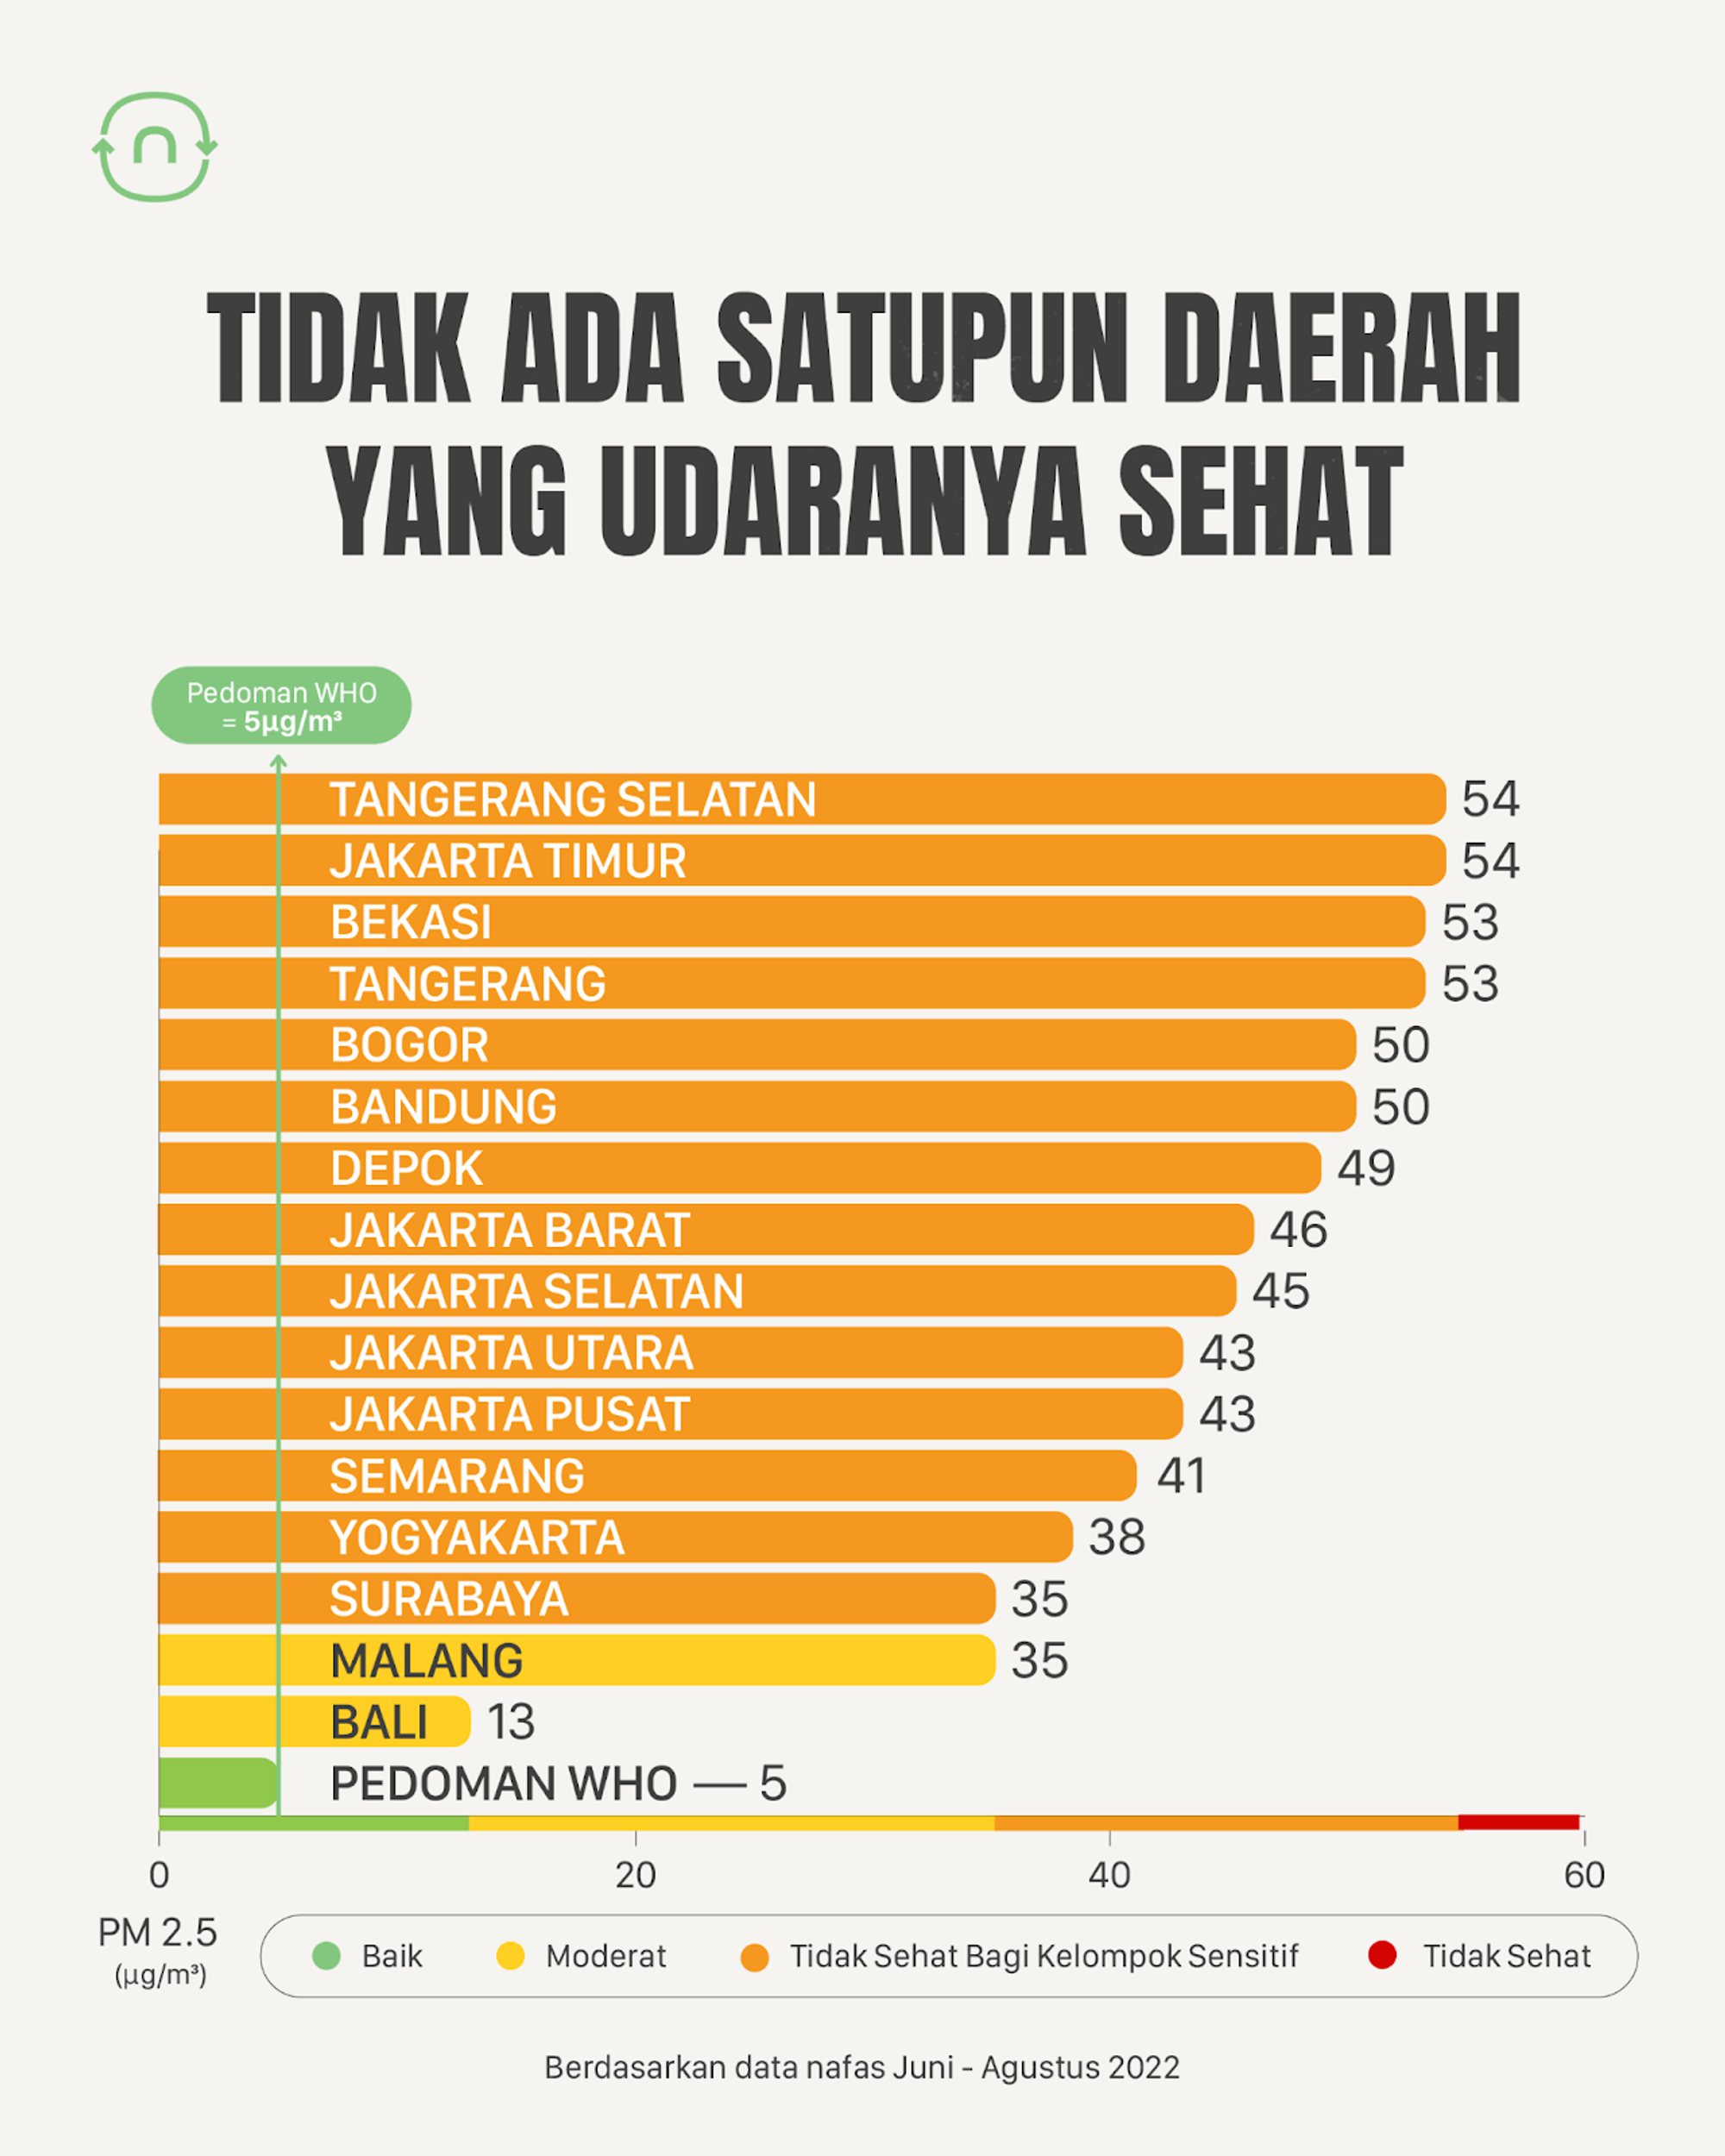
Almost all of the areas covered by nafas sensors had recorded high levels of PM2.5. South Tangerang and East Jakarta led the rank with PM2.5 level of 54 µg/m3, or 11 times above WHO guideline (5 µg/m3).
This finding further exposes June - August as a bad air season for Indonesia. One of the main causes of worsening air pollution was the overall decrease of wind speed and atmospheric events, as the country entered the dry season.
Residential areas in Bodetabek have a higher PM2.5 pollution level
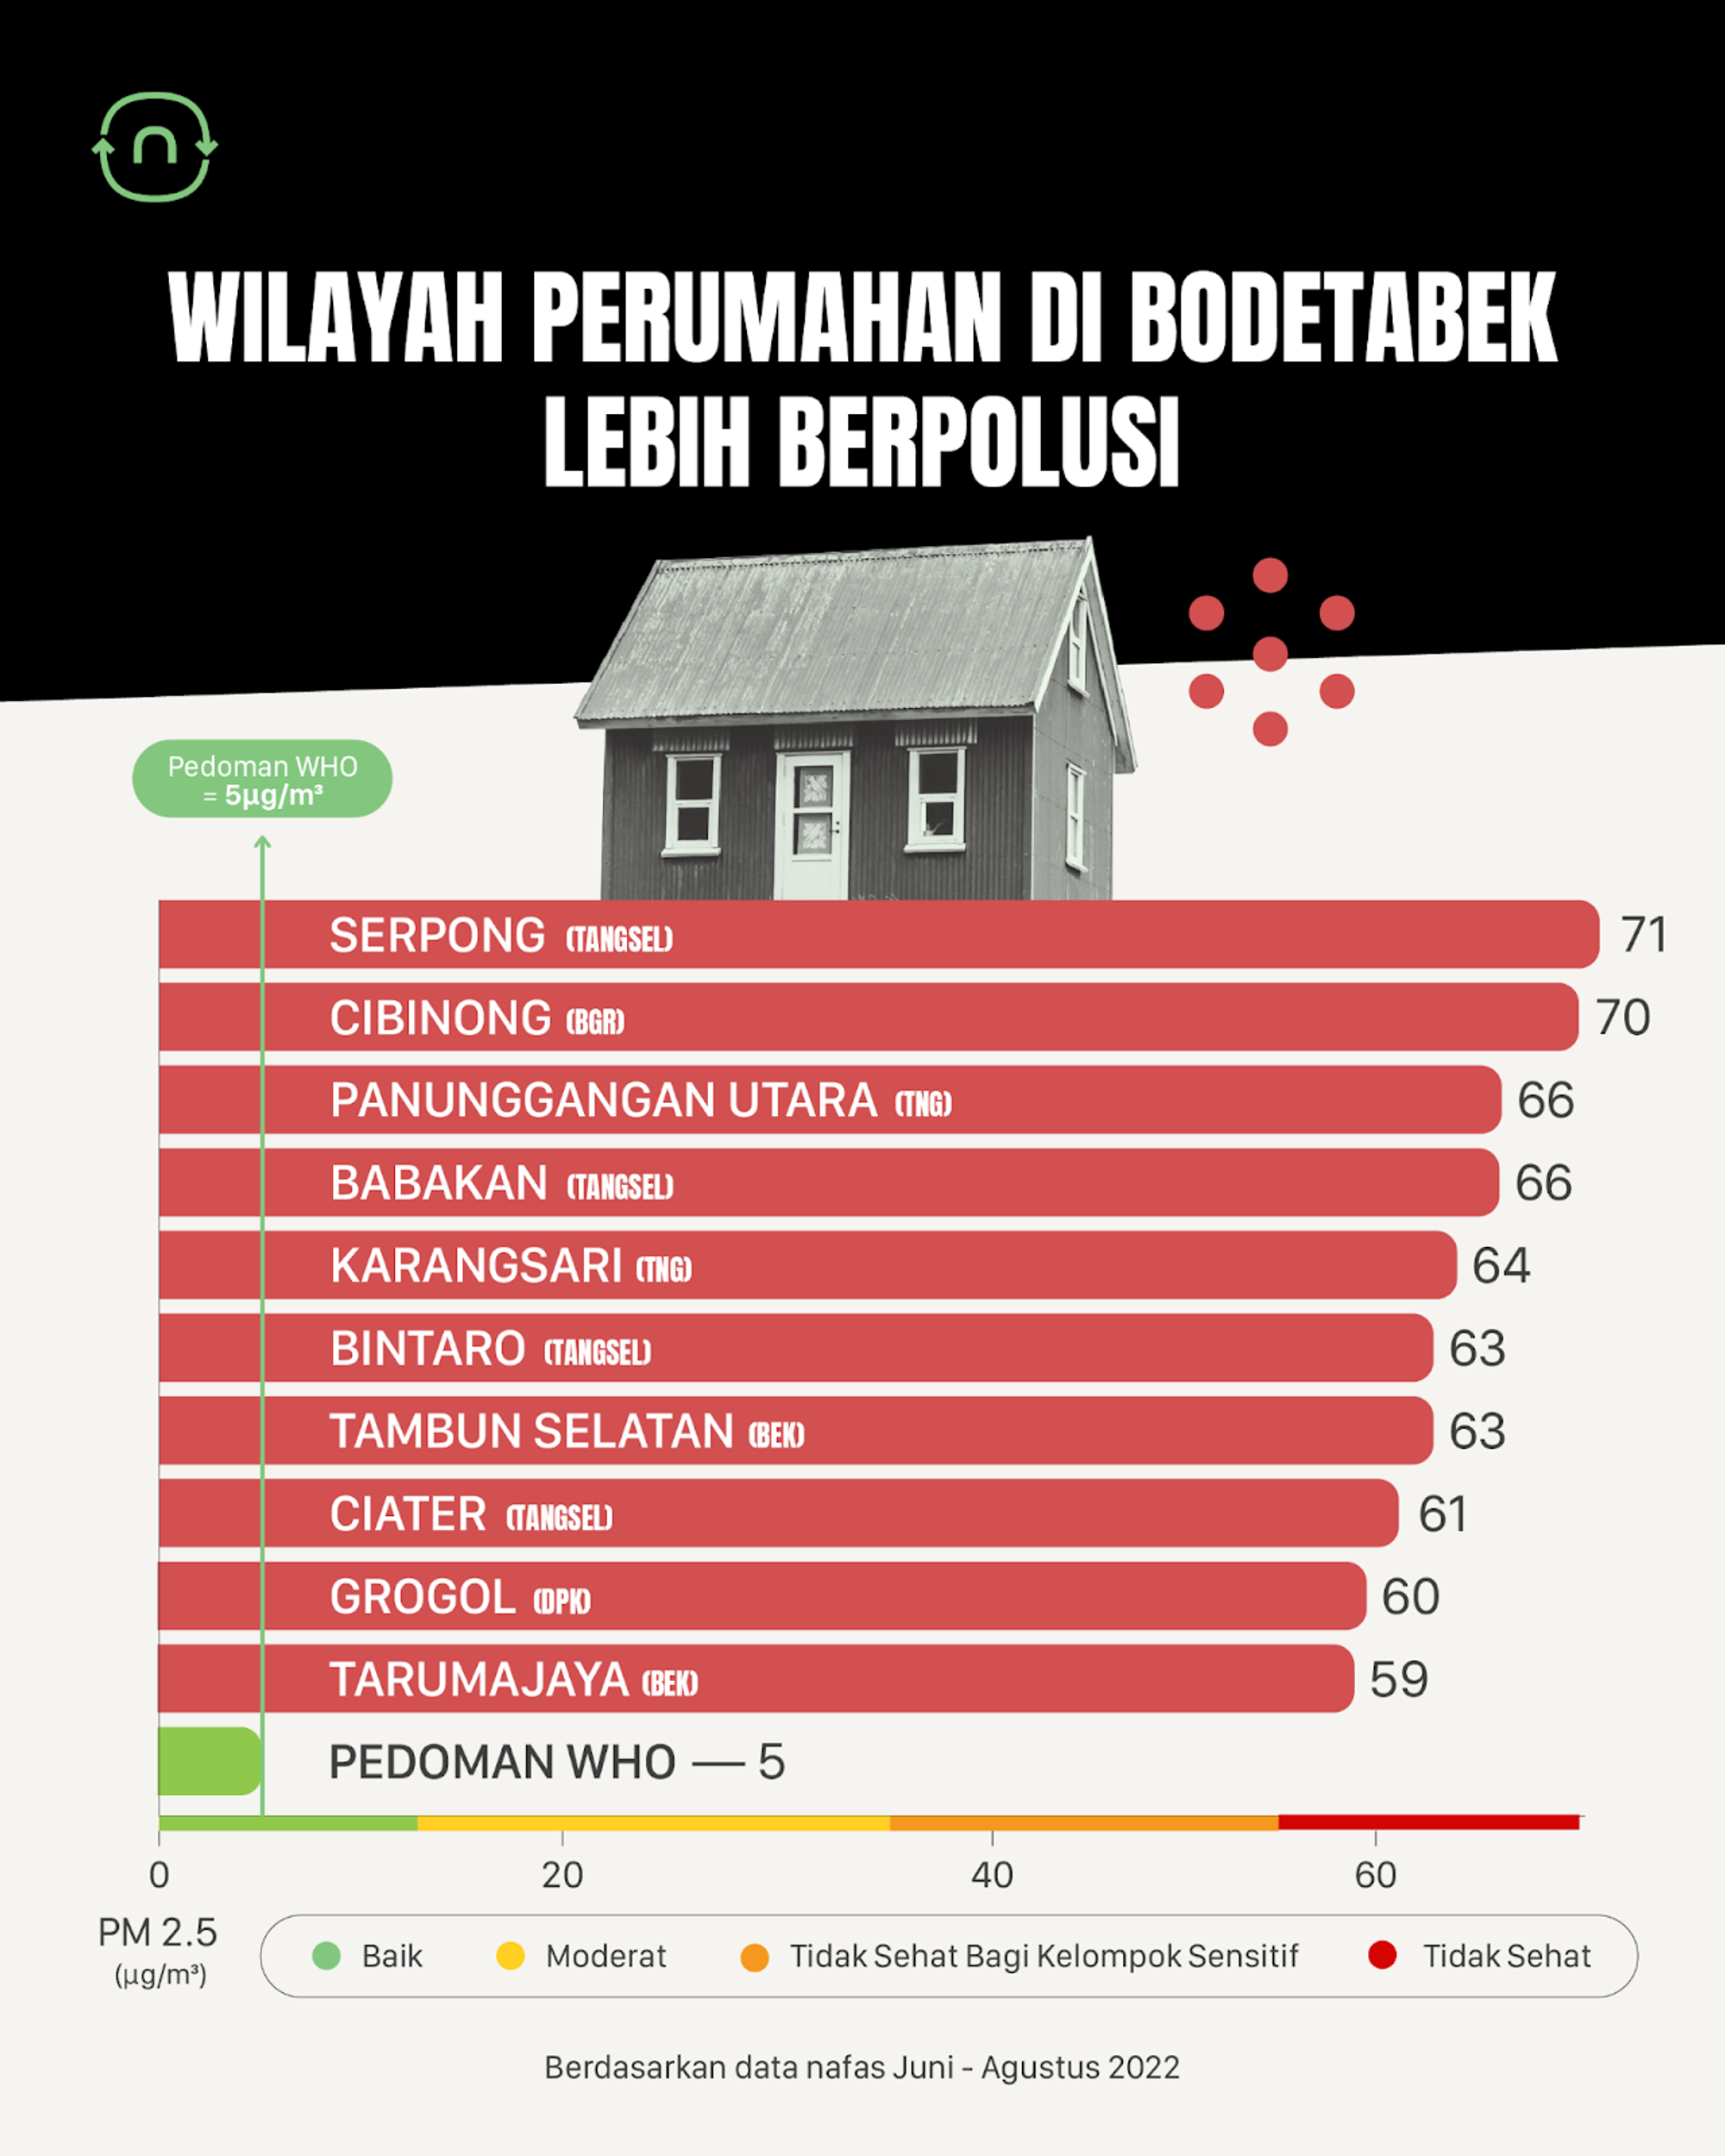
On average, the air quality in residential areas around Bogor, Depok, Tangerang and Bekasi are worse than others. This is found based on nafas’ real time air quality data, which was captured through our monitoring sensors.
Serpong (South Tangerang) received a badge of honour as the most polluted area with PM2.5 levels that reached 71 µg/m3. The list continued with Cibinong (Bogor) which was recorded to have 70 µg/m3 of PM2.5 concentration and followed by Panunggangan Utara (Tangerang) with 66 µg/m3. Besides suffering from a lack of wind in that area, there are also hyperlocal factors in play, such as trash burning and unregulated small industrial activities.
High grounds and green areas are also polluted.
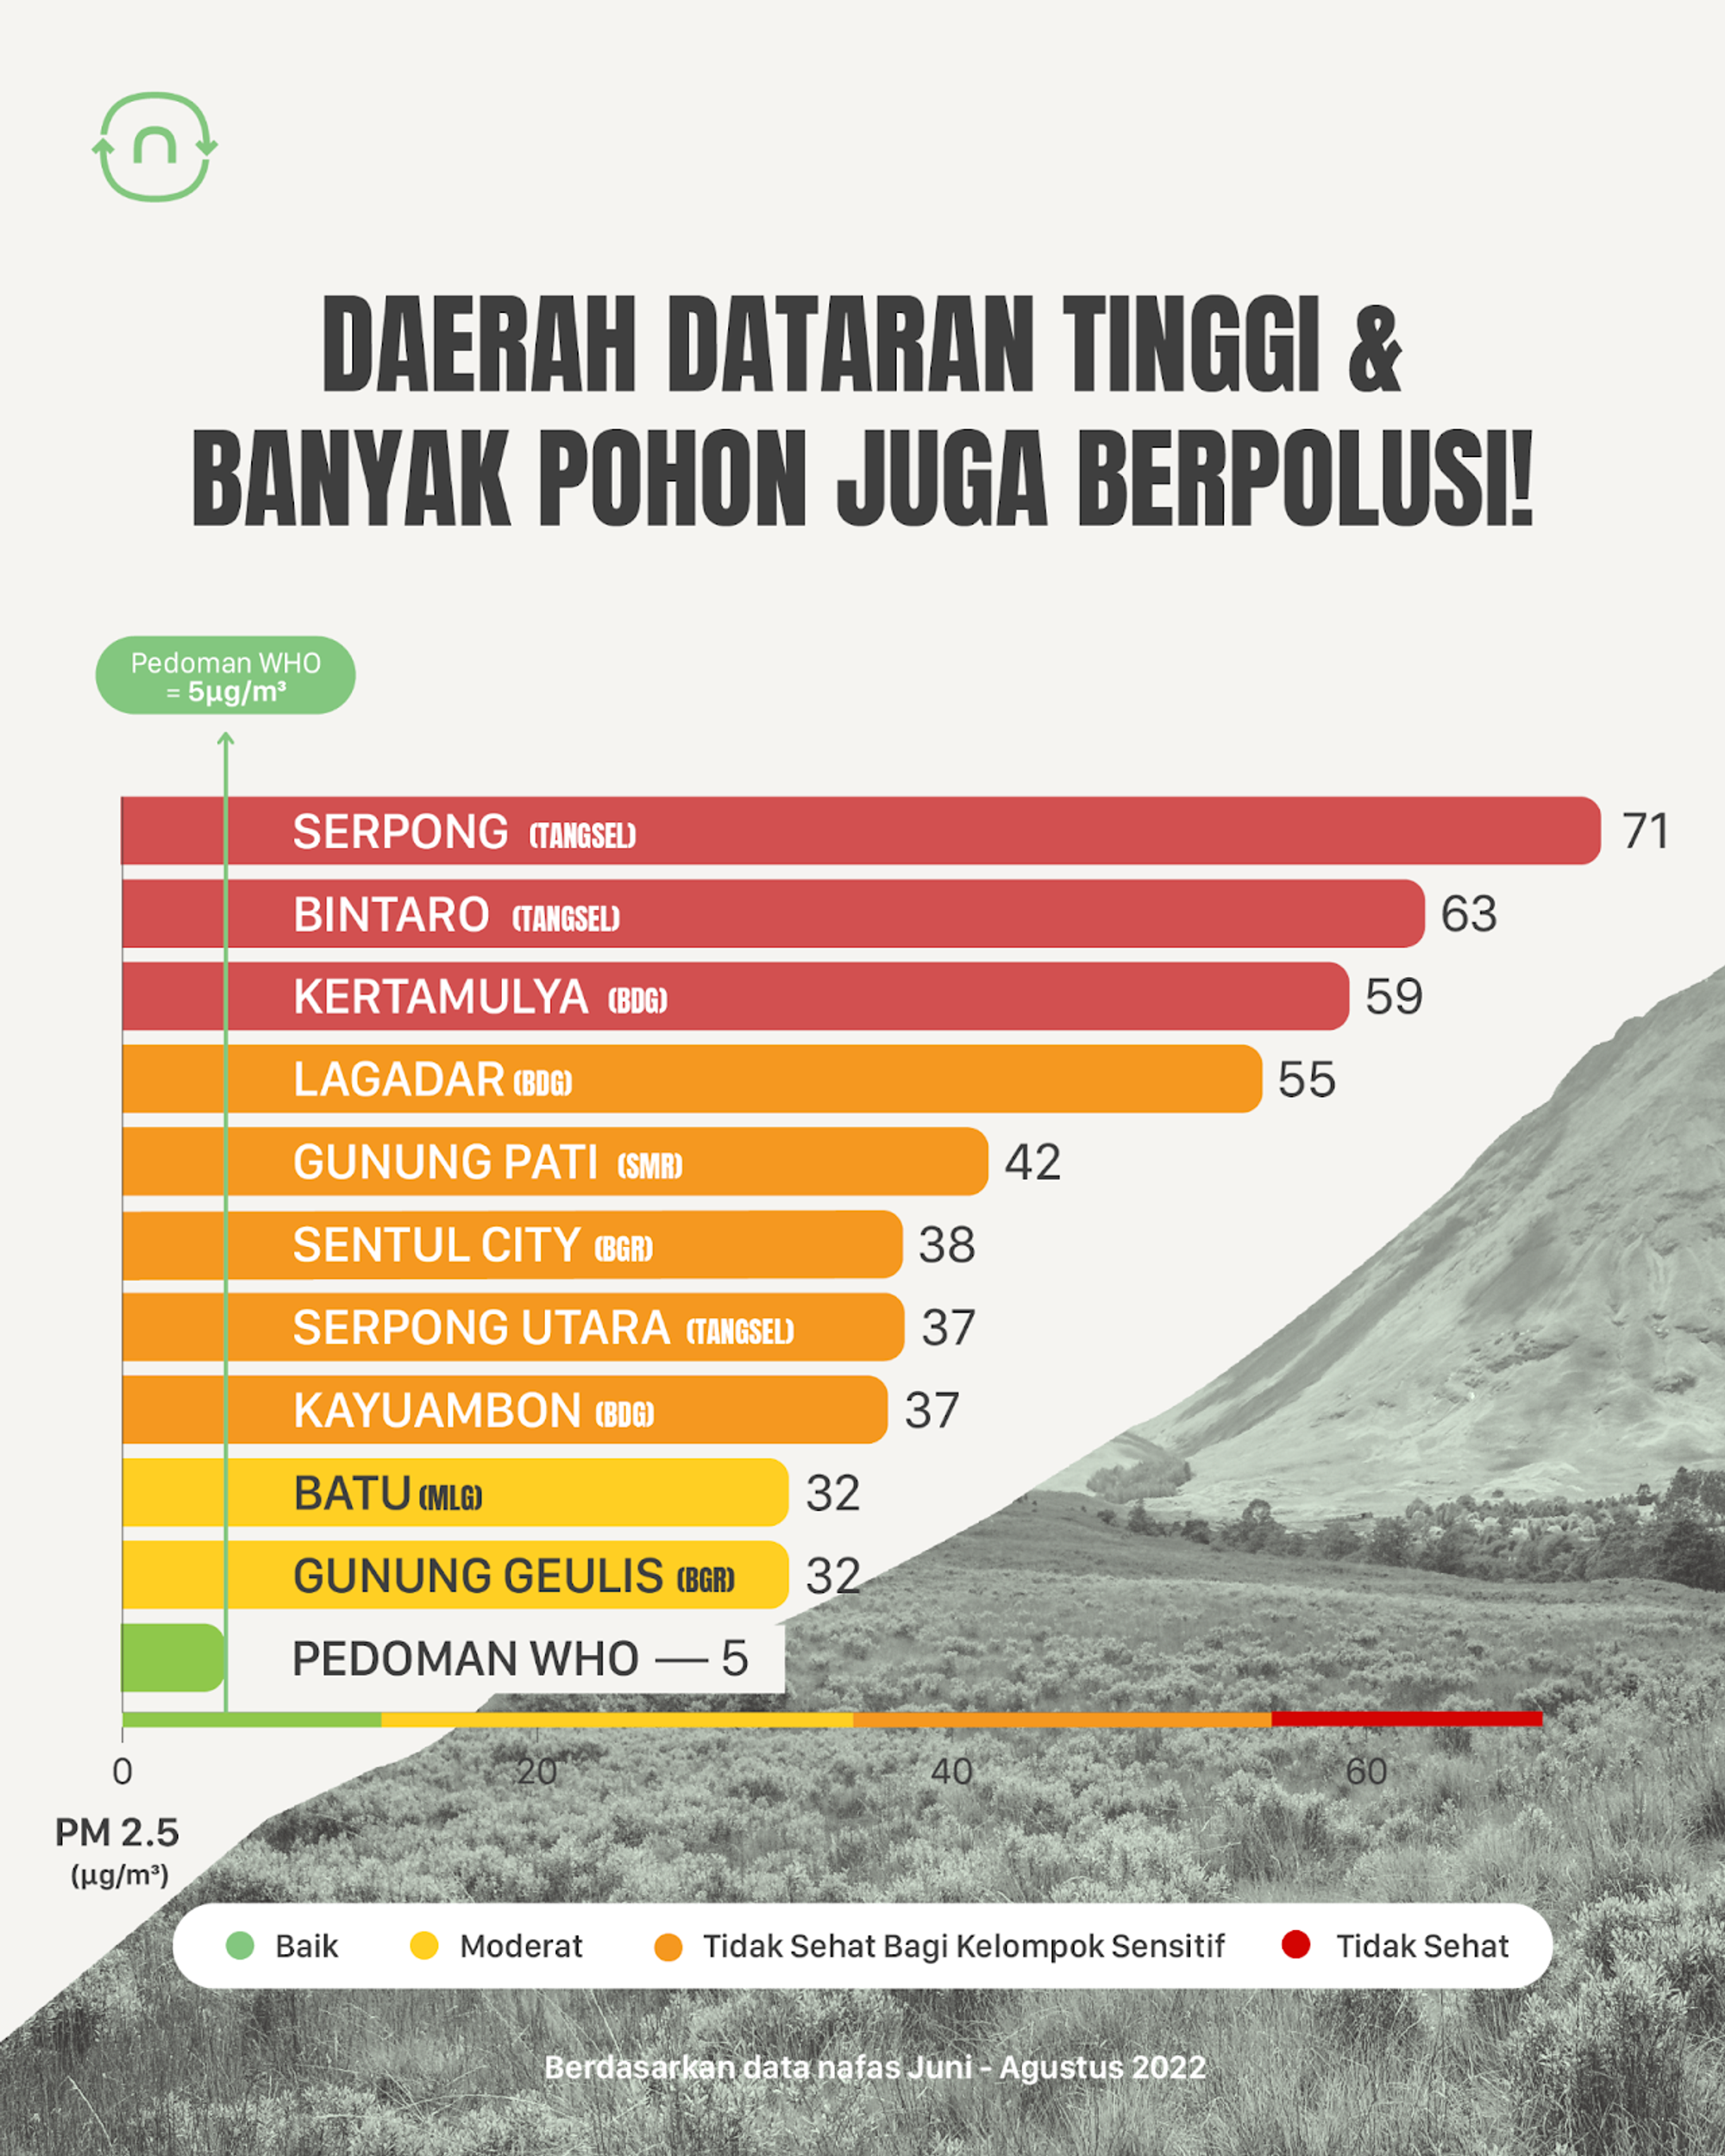
The last finding is not even considered as breaking news anymore, because nafas had frequently talked about it in the past. The fact is, high grounds and areas with many trees are also polluted.
These locations at the top of the graph above are observed to be the most polluted during certain days during the “bad air season”. For instance, Serpong and Bintaro, two of the considerably most “green” areas in Tangerang Selatan, are in fact homes to high levels of PM2.5 pollution.
In three months, the average PM2.5 pollution levels in Serpong and Bintaro were 13 to 14 times higher than WHO guideline. Kertamulya in Bandung was recorded to be slightly below those two locations, with PM2.5 levels that reached 59 µg/m3. However there are some areas with air quality that was just “okay”, such as Batu, Malang and Gunung Geulis, Bogor. Nevertheless, the two locations’ PM2.5 levels were still as high as 6 times above the WHO guideline.
💡 Check out our Instagram and Twitter @nafasidn to see a compilation of Pollution Party matches or click this link to find out more bit.ly/pestapolusi2022.