What is a "hyperlocal source” of air pollution?
Are you aware that the air quality has recently improved? Our air quality has improved since the beginning of the rainy season. Strong winds during the rainy season contribute significantly to enhanced air quality in several cities in Indonesia.
This, however, does not happen every day. Inevitably, the air quality at some points of the Nafas sensor turns red, indicating unhealthy air quality.
So, what causes this?
This is due to hyperlocal sources!
🧐 In this article, we will inform you about:
- The air in each place can be very different due to hyperlocal sources
- Air quality information in Cilandak, Cawang, and Duri Utara as locations exposed to hyperlocal sources, reaching 9x above the WHO recommended limit.
- Important steps to avoid exposure to air pollution.
Knowing the hyperlocal source
The locations and characteristics of hyperlocal air pollution hotspots may change over time. This can happen because of various sources of pollution, such as open waste burning, cigarette smoke, fogging, industrial emission, and even smoke produced by cooking activities. The air quality will deteriorate as the number of pollutant sources increases and vice versa.
The presence of these hyperlocal sources is evidenced by a quick increase in PM2.5 pollution that lasts only a few hours. The Nafas sensor recently detected a significant increase in three locations.
#1 📍 Cilandak, South Jakarta
Cilandak in South Jakarta is one of the locations where air pollution levels have increased due to hyperlocal sources. Check the graphs!
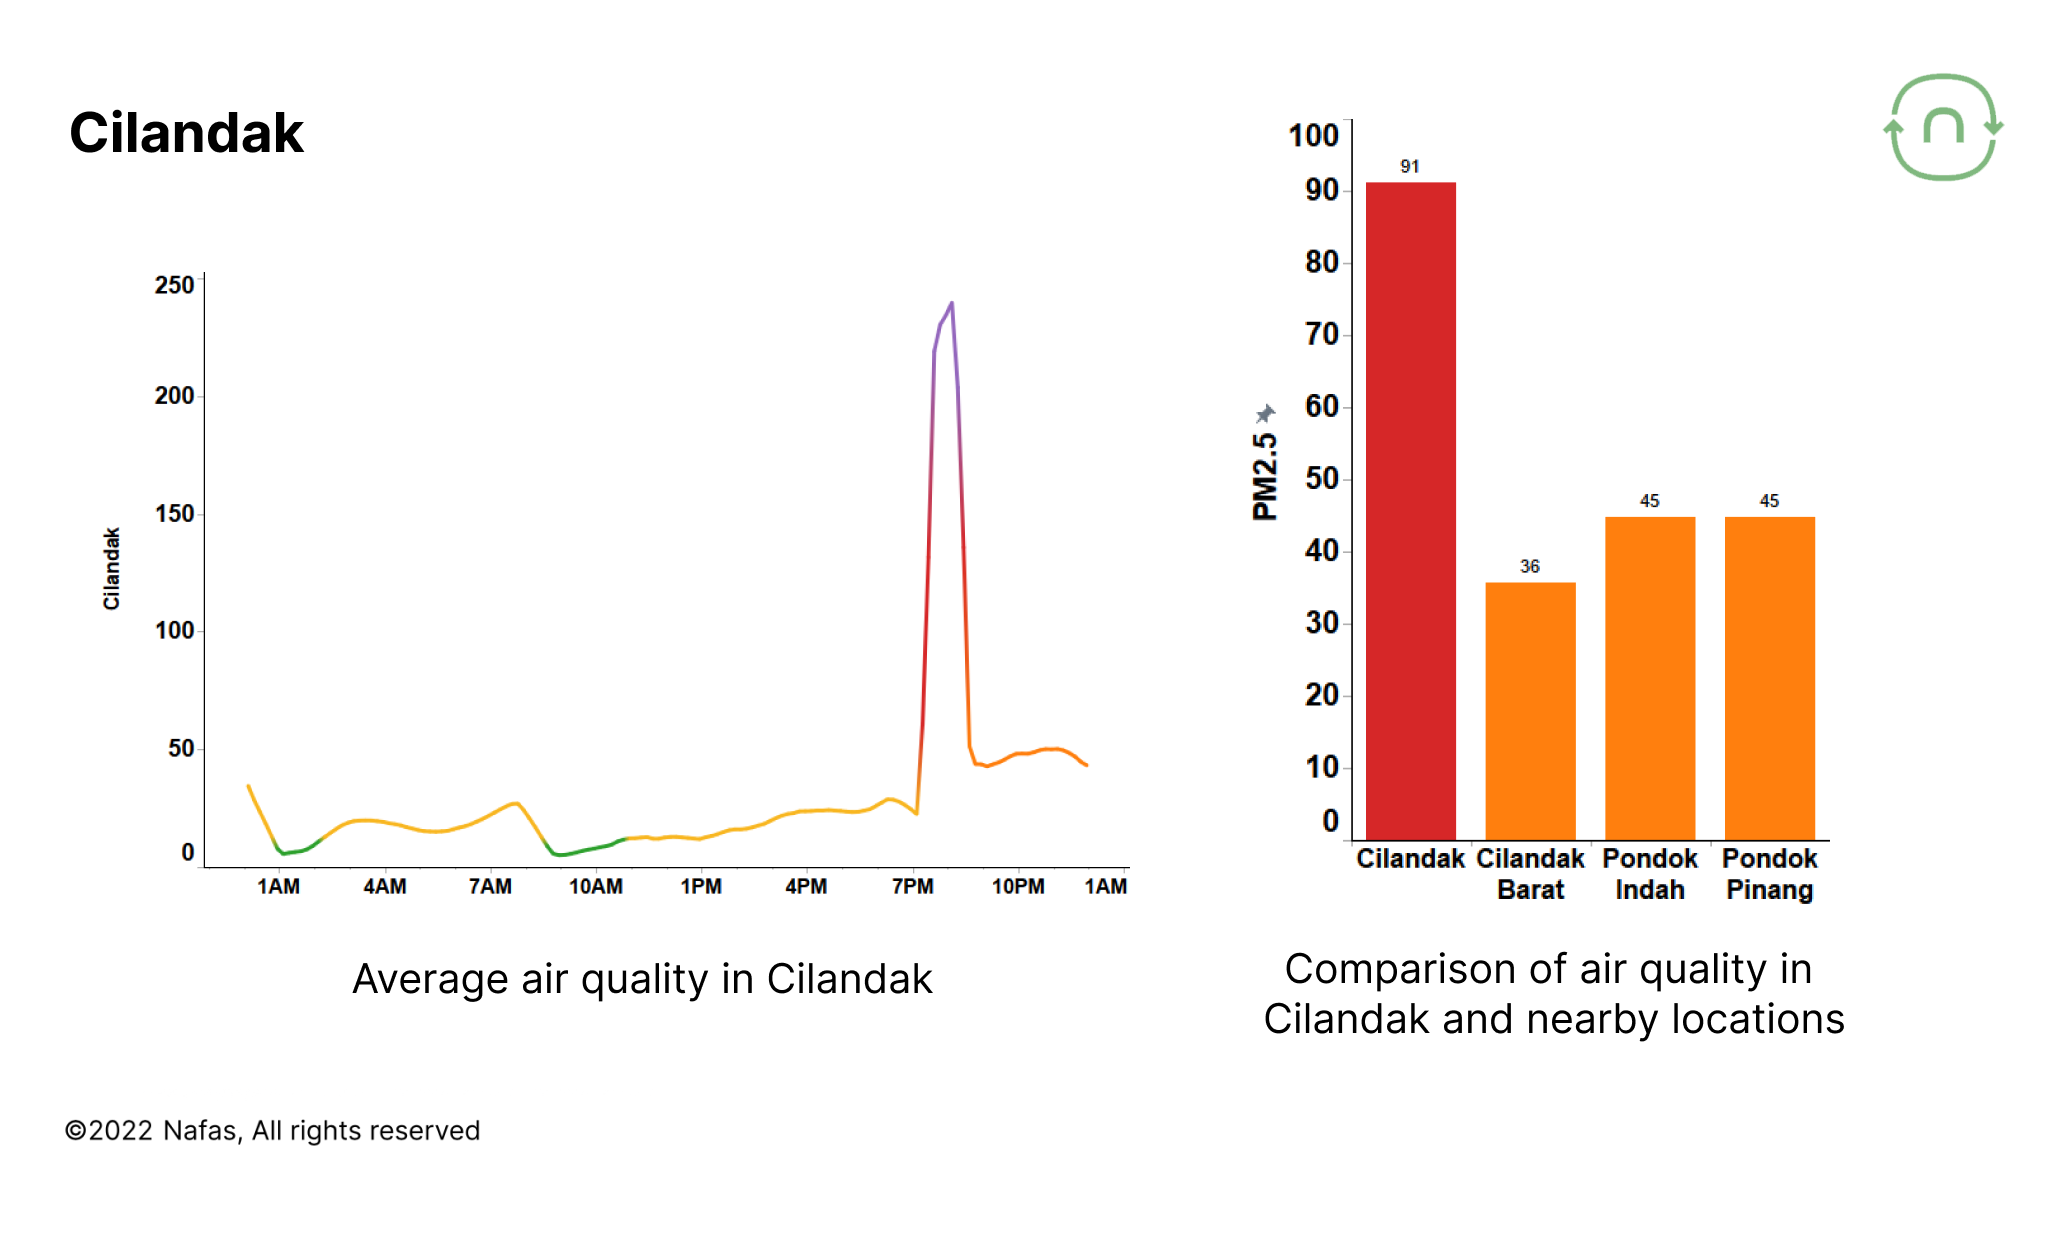
The graph shows that the average air quality in Cilandak is 28 µg/m³, while on October 2, 2022, the sensor reached 240 µg/m³ between 19.00 and 22.00 WIB. This is an increase of 9x above the average! The significant difference in data suggests that the Nafas sensor detected a hyperlocal source of PM2.5 pollution.
#2 📍 Cawang, East Jakarta
Cawang, an administrative village in East Jakarta, has also experienced the same thing. Let's take a look at the graph below!
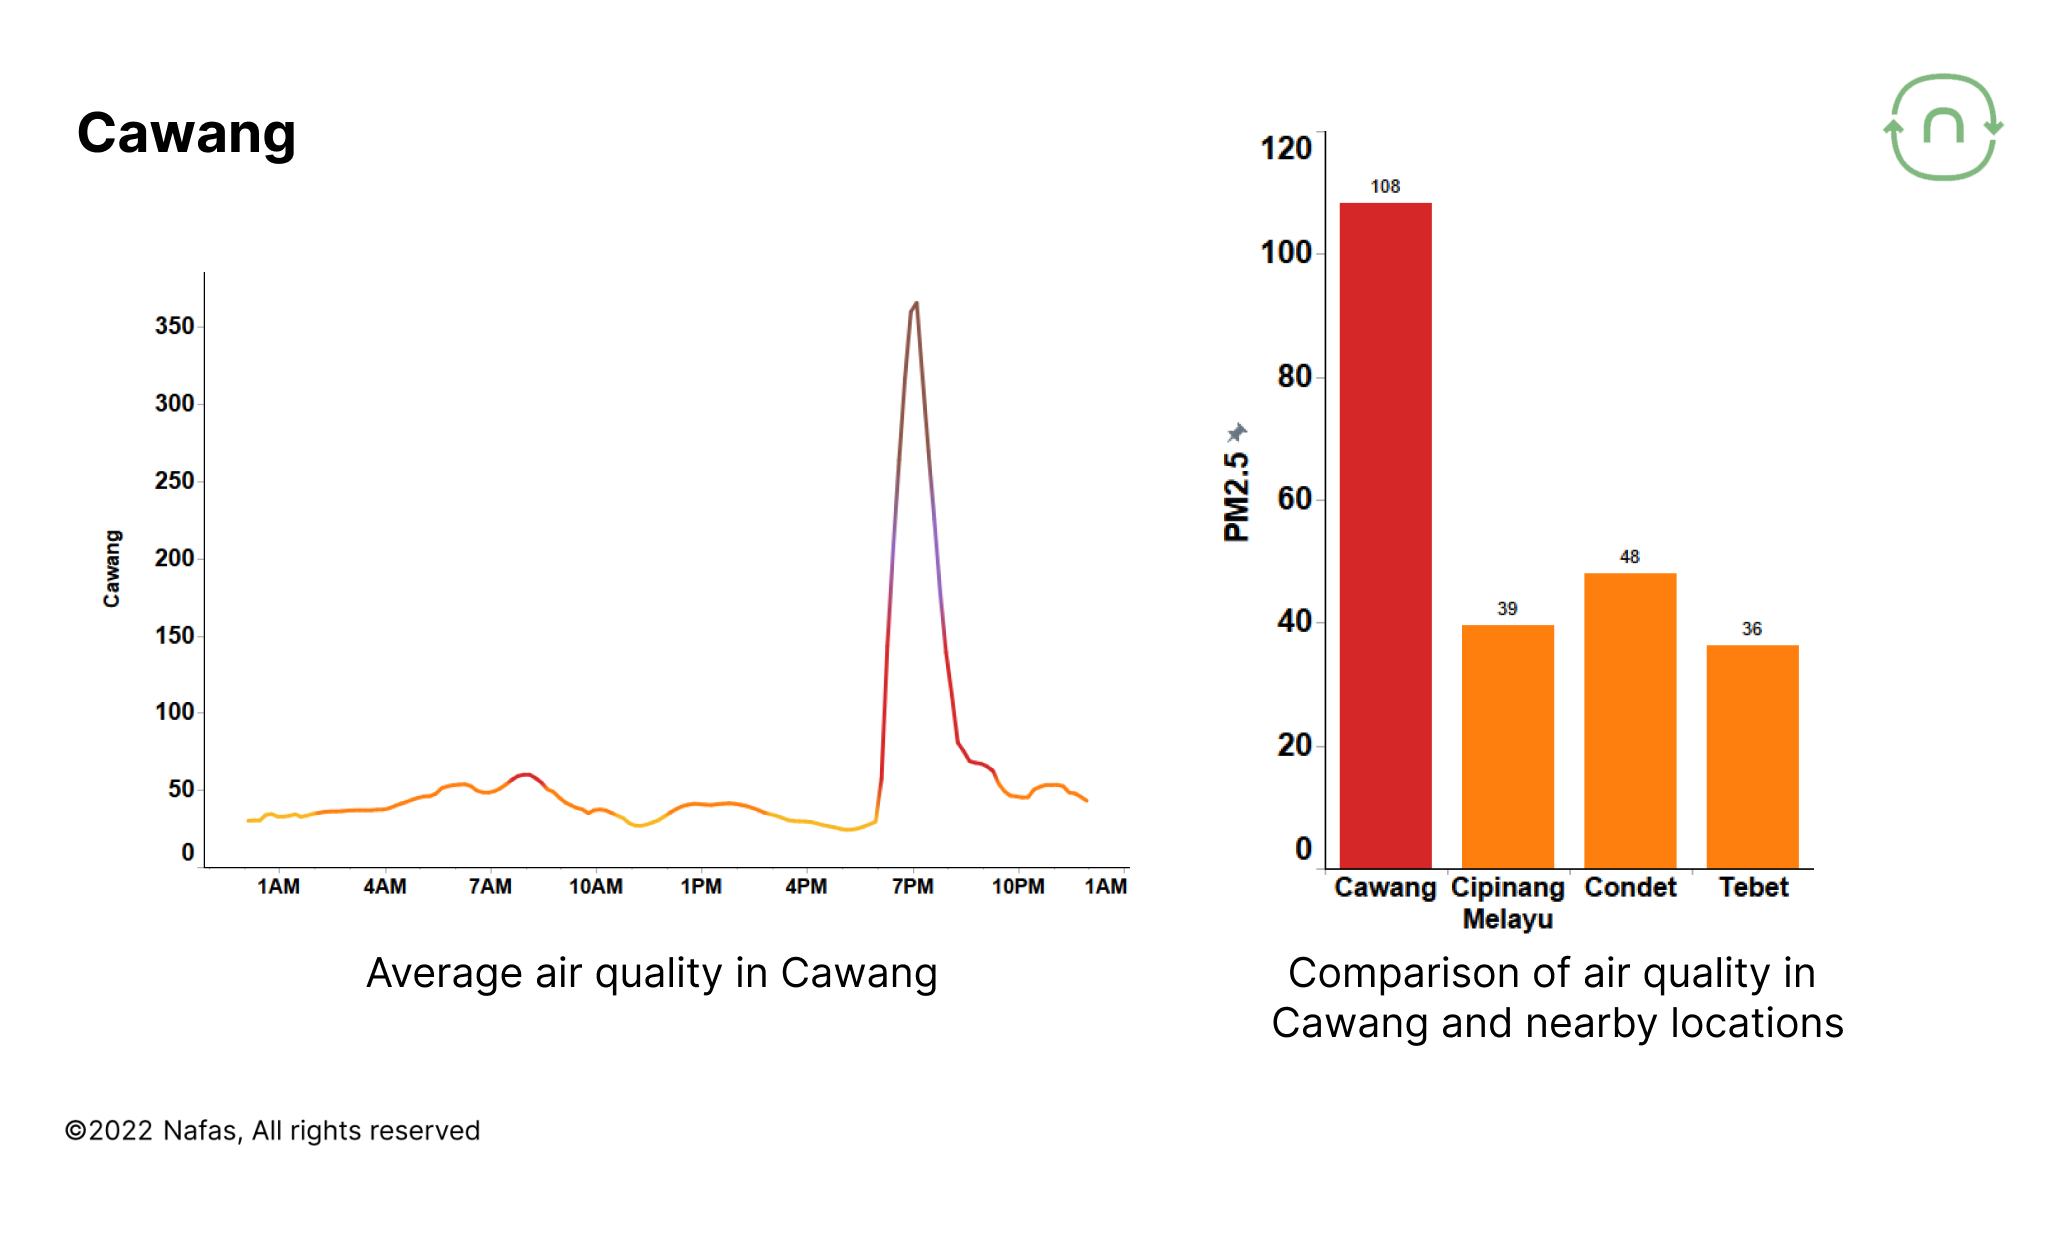
In Cawang, the average measured PM2.5 concentration is 41 µg/m³, but on Sep 12, 2022, it reached 336 µg/m³ at 19:00 to 22:00 WIB. About 9x above average!
#3 📍 Duri Utara, West Jakarta
The Nafas team also found a similar thing in Duri Utara, West Jakarta, where the increase in pollution occurred in the afternoon on October 5, 2022.
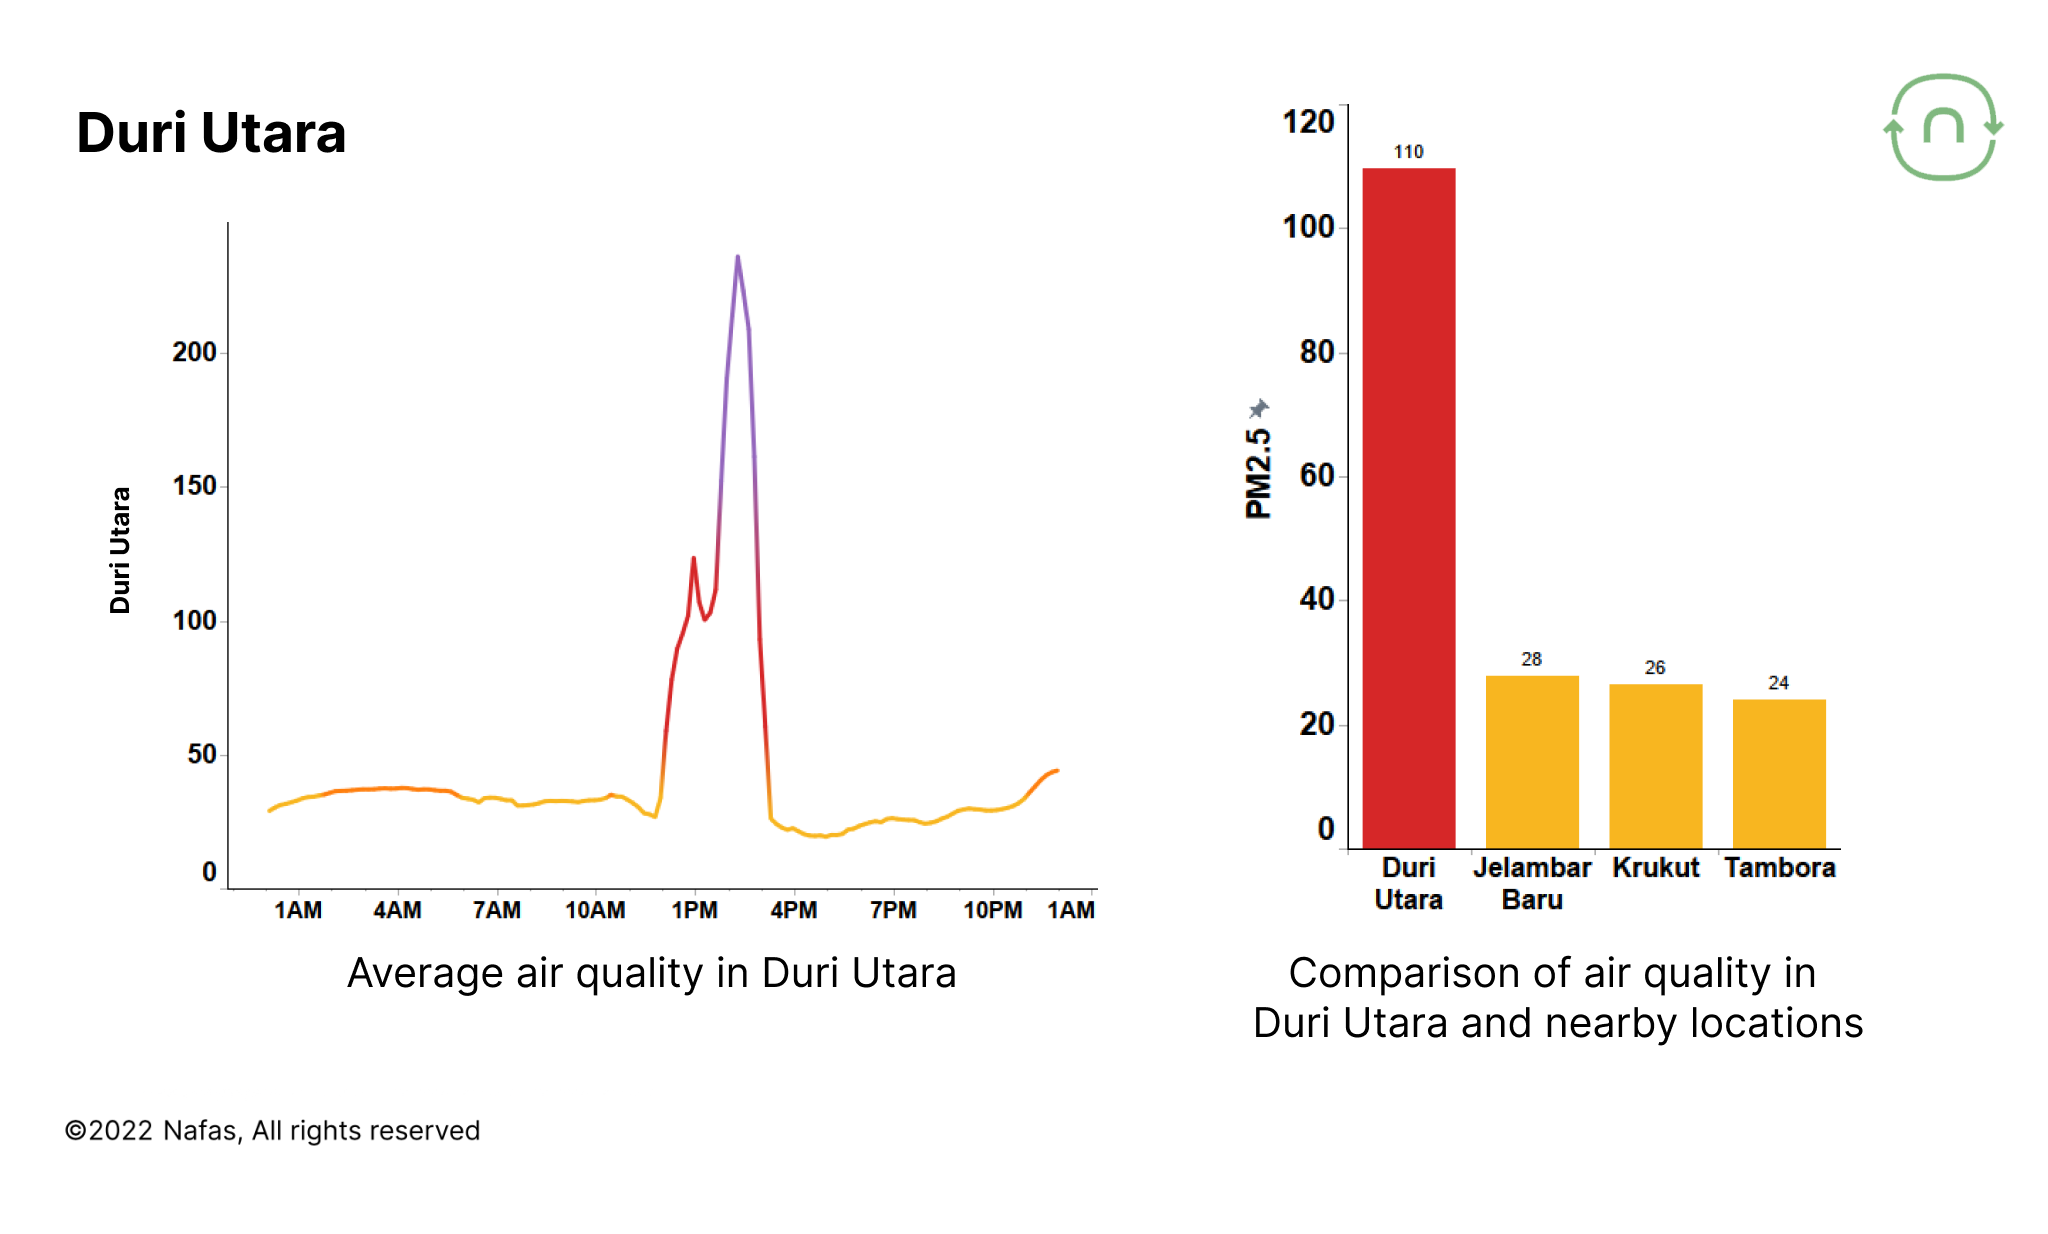
At 11.00 AM - 3.00 PM, you can see on the graph that the daily average at the sensor is 30 µg/m³, but there is an increase in PM2.5 pollution that reaches 236 µg/m³.
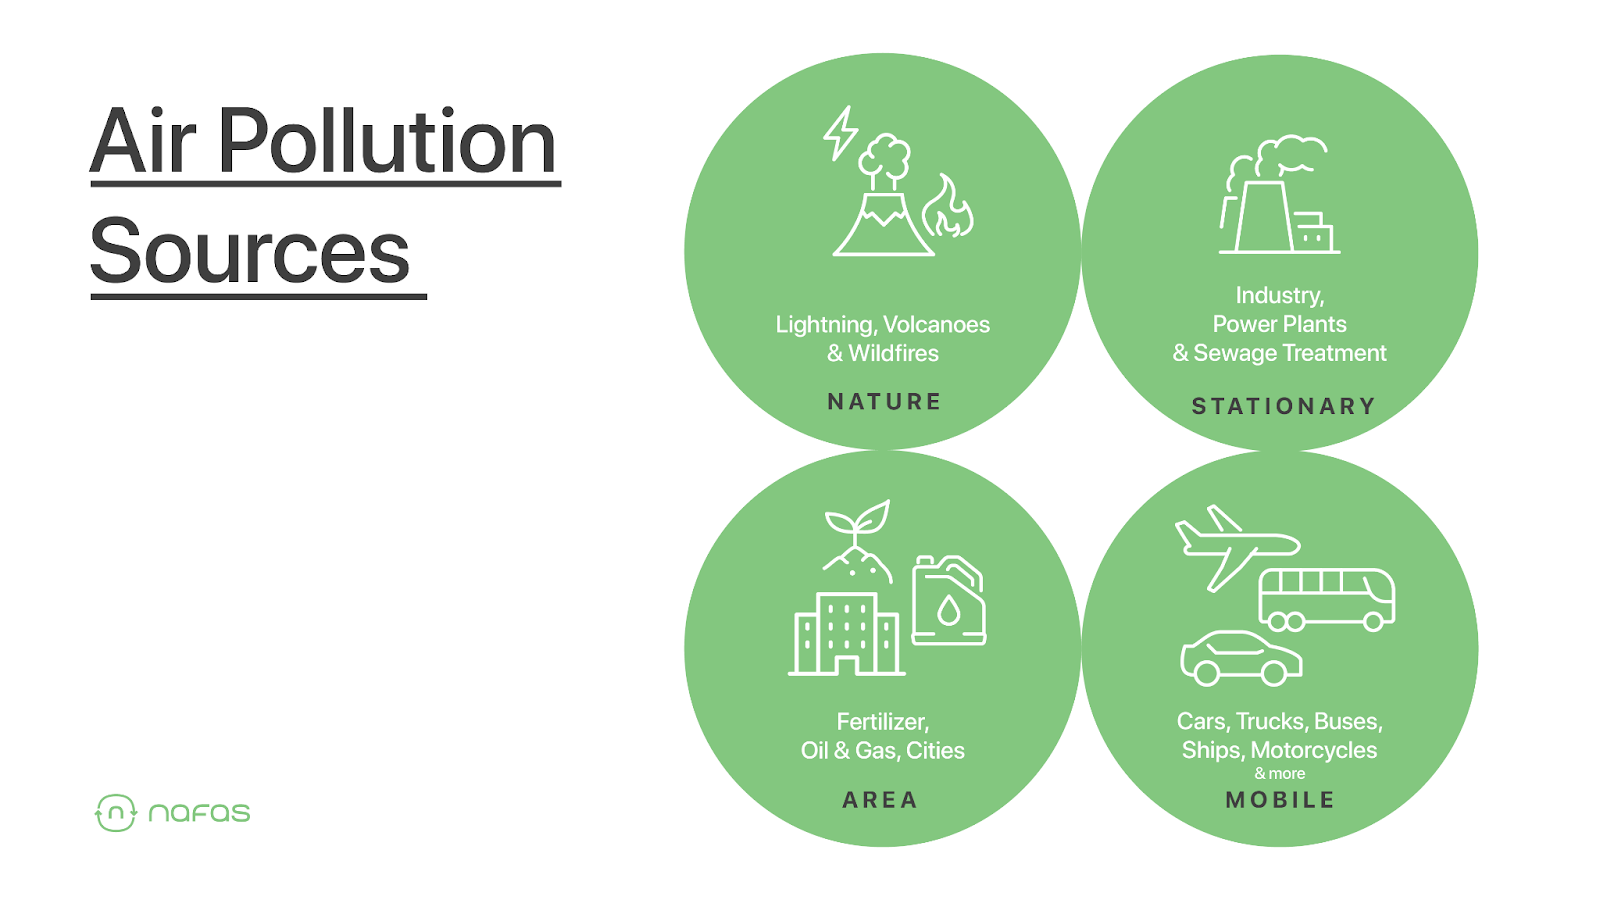
Learn where air pollution comes from
Air pollution sources are classified into four types: stationary sources, mobile sources, area sources, and natural sources. Stationary sources are immovable sources, such as a chimney in an industrial factory or a fireplace at home. Whereas, mobile sources are movable sources, such as cars, motorcycles, planes, trains, and other fuel-powered vehicles.
An area source is a region in which there are activities that produce air pollution, such as industrial areas, livestock areas, cities, and burned forest areas. On top of that, natural sources come from nature without any interference from human activities, for example, erupting volcanoes, windblown dust, and forest fires.
Sources of air pollution affect the concentration of pollutants in an area. This variety of sources is one of the factors to consider when installing air quality sensors.
Inequality of air pollution requires hyperlocal air monitoring. Hyperlocal air monitoring will make you more aware of local influences on air pollution levels. The more sensors installed, the more detailed the data obtained in each different area. Thus, the sensor results for each area will also be different. That's why Nafas has more than 180 sensors in various cities.
How to reduce PM2.5 exposure from hyperlocal sources?
In conclusion, even though the air quality is improving due to the rainy season, we should all continue to monitor the PM2.5 pollution levels in the area where we live. To reduce your exposure to PM2.5, you can take the following actions:
- Always monitor outdoor air quality with the Nafas app to plan your day before outdoor activities.
- Reduce activities near air pollution sources as much as possible, such as busy roads, combustion activities, etc. Wearing a mask is a must!
- For the long term, if you see any waste-burning activities around you (which is prohibited), report them through the JAKI app. Your report will be forwarded to the relevant Environmental Agency.
Nafas is always trying to expand our sensor network even further. You can also host our sensors by registering yourself here.