Bandung is getting colder, but is the air getting cleaner?
Imagine there was a question: "Name one city where people in the capital go to enjoy their weekend!", Bandung might be one of the answers. Being a city full of quirky cafes, nice shops, and a breezy environment, Bandung is always a lively place to go on the weekends.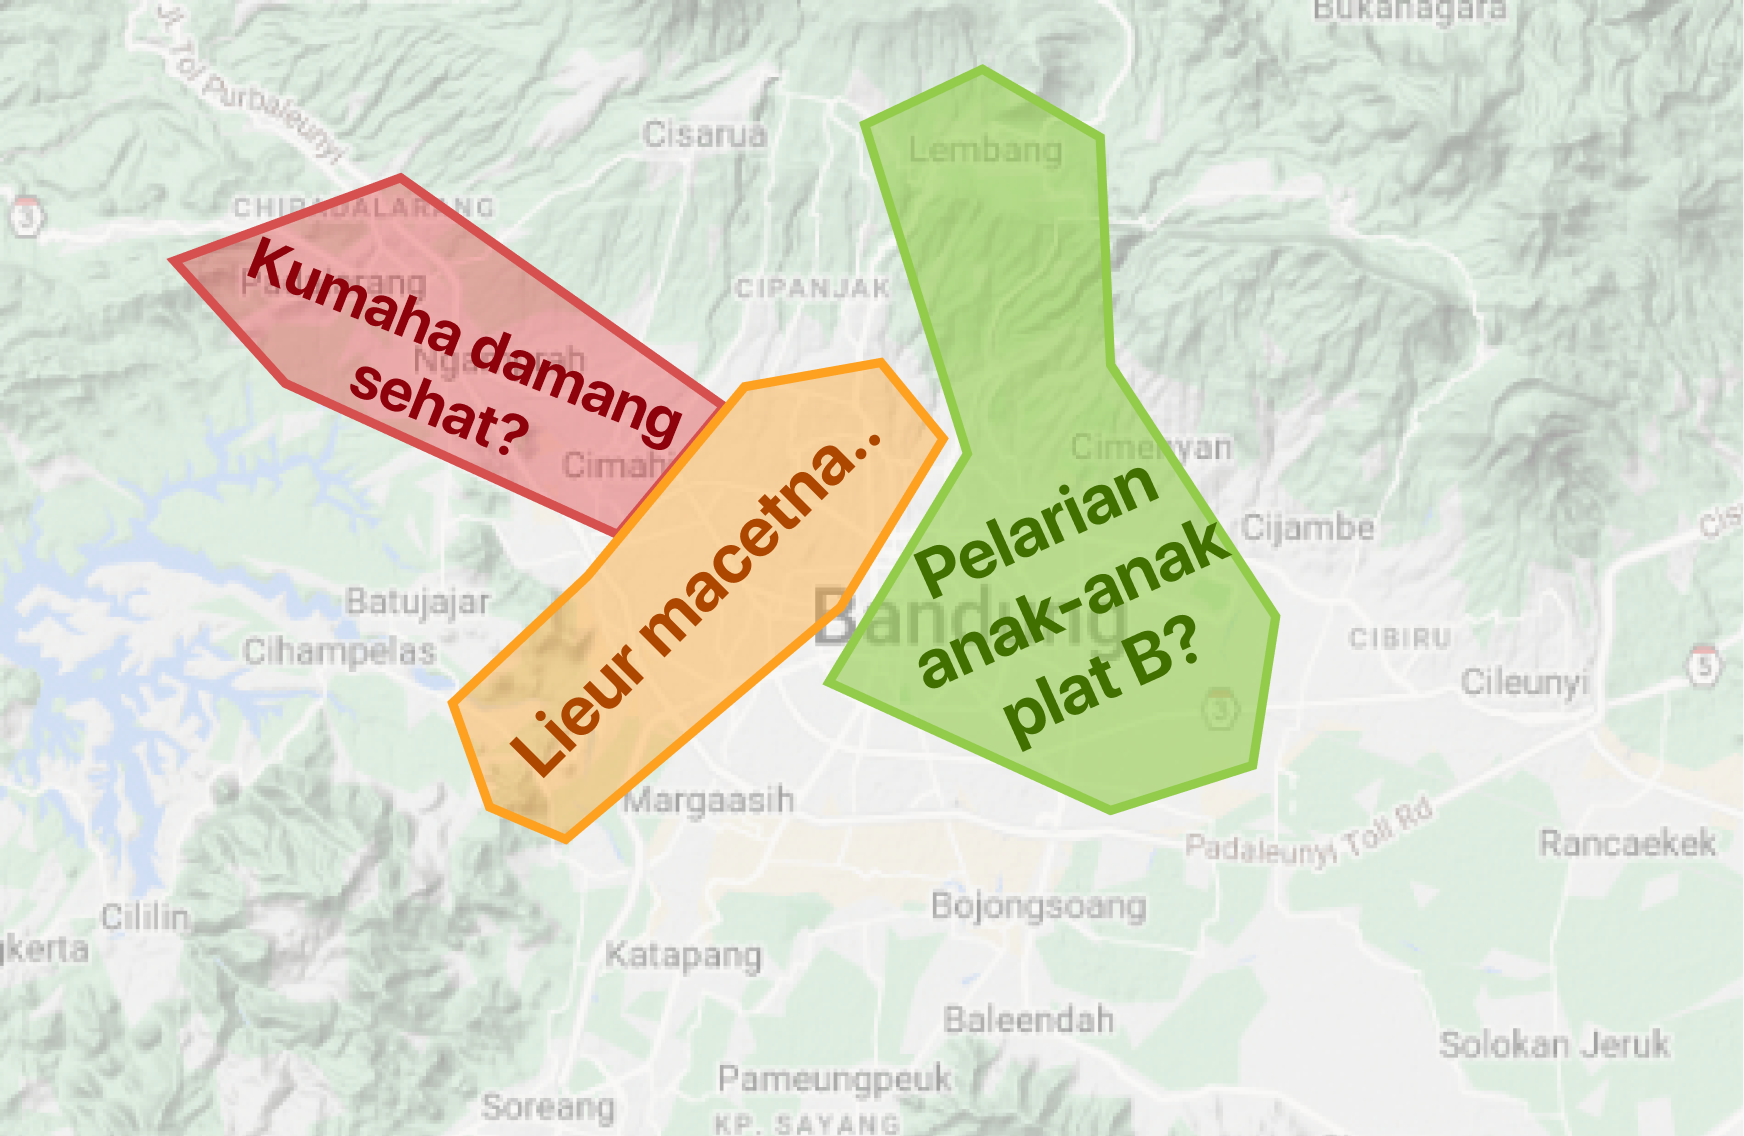
The crowds of people and cars traveling in Bandung affect its air quality. So, what is the condition of the air quality? 🤨
Let's take a look at Bandung's air quality facts together!
———————
⛰️ West and Northwest Bandung are more polluted than Bandung City
Bandung's zones are divided into three: West, Center, and East. The zoning is taken from the average data of each sensor from January to July 2023. This is based on model results that show PM2.5 was mostly distributed towards the West, Northwest, and North of Bandung city in July. (Salsabila et al., 2021)
Take a closer look at the map of Bandung City! At first glance, you can see that the western and northwestern parts of Bandung are polluted with unhealthy air (red and orange colors), while the eastern part of the city is moderately polluted (yellow color). To make things easier for you, the Nafas team sorted each area in Bandung to see the level of air pollution in more detail, as follows.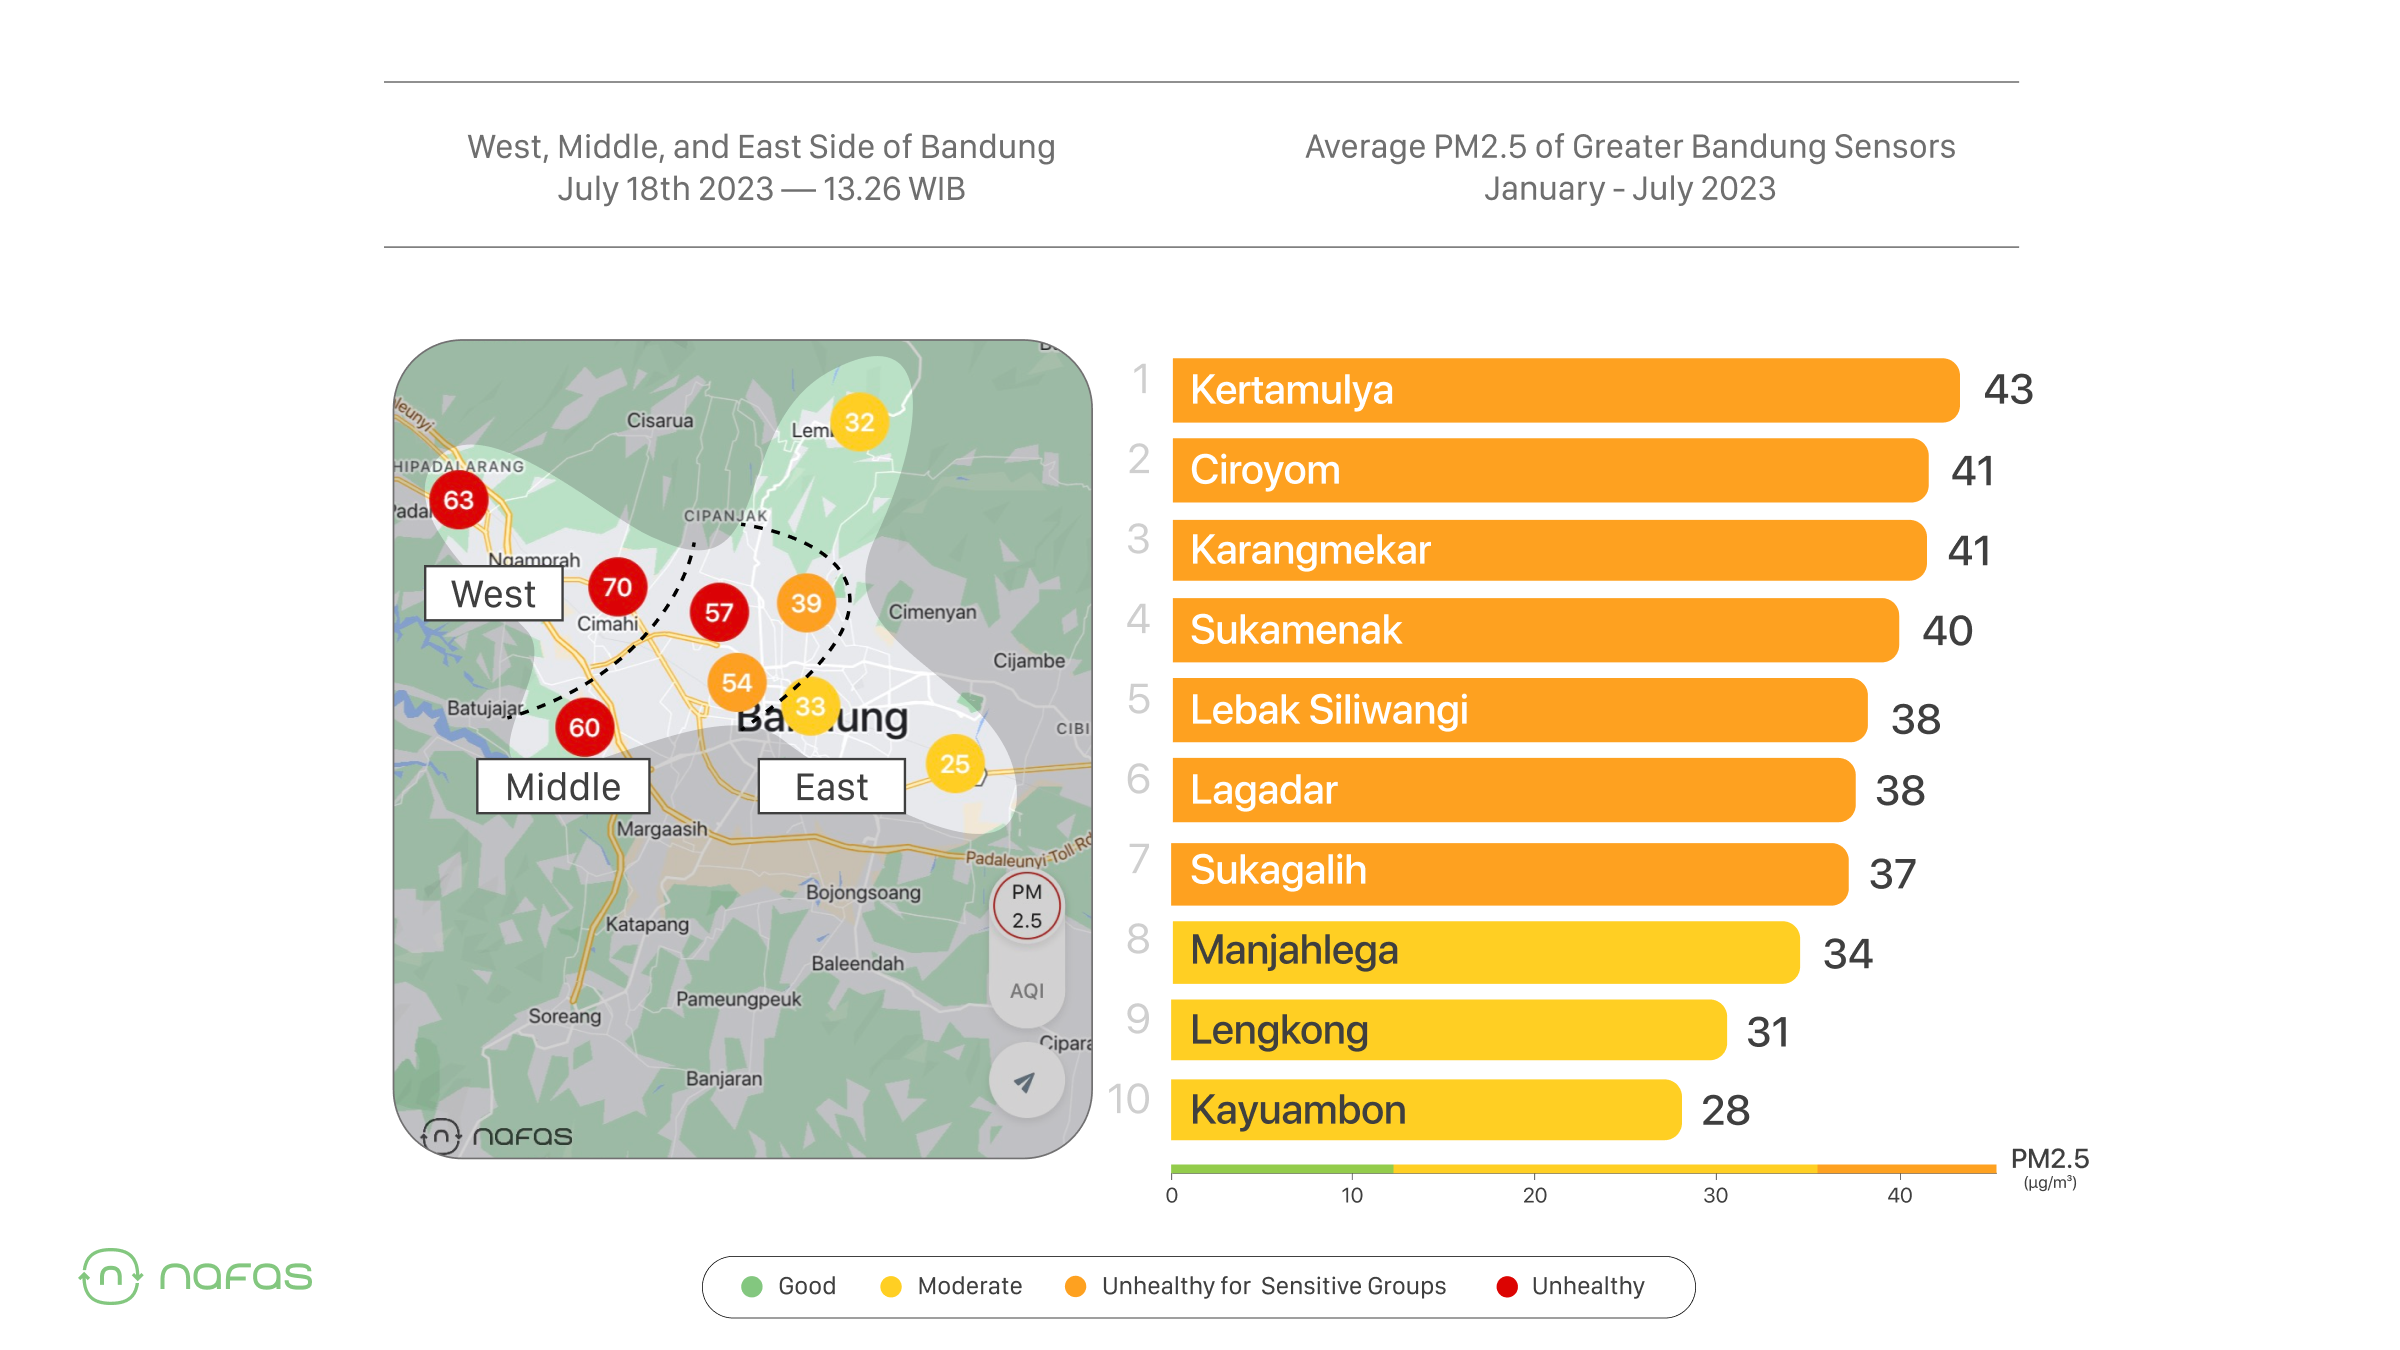
As we can see, the average air quality of eastern Bandung in 2023 is better than central and western Bandung. Kayuambon and Lengkong in East Bandung are the two areas with the lowest number of air pollution.
💀 Bandung is much more polluted than DKI Jakarta
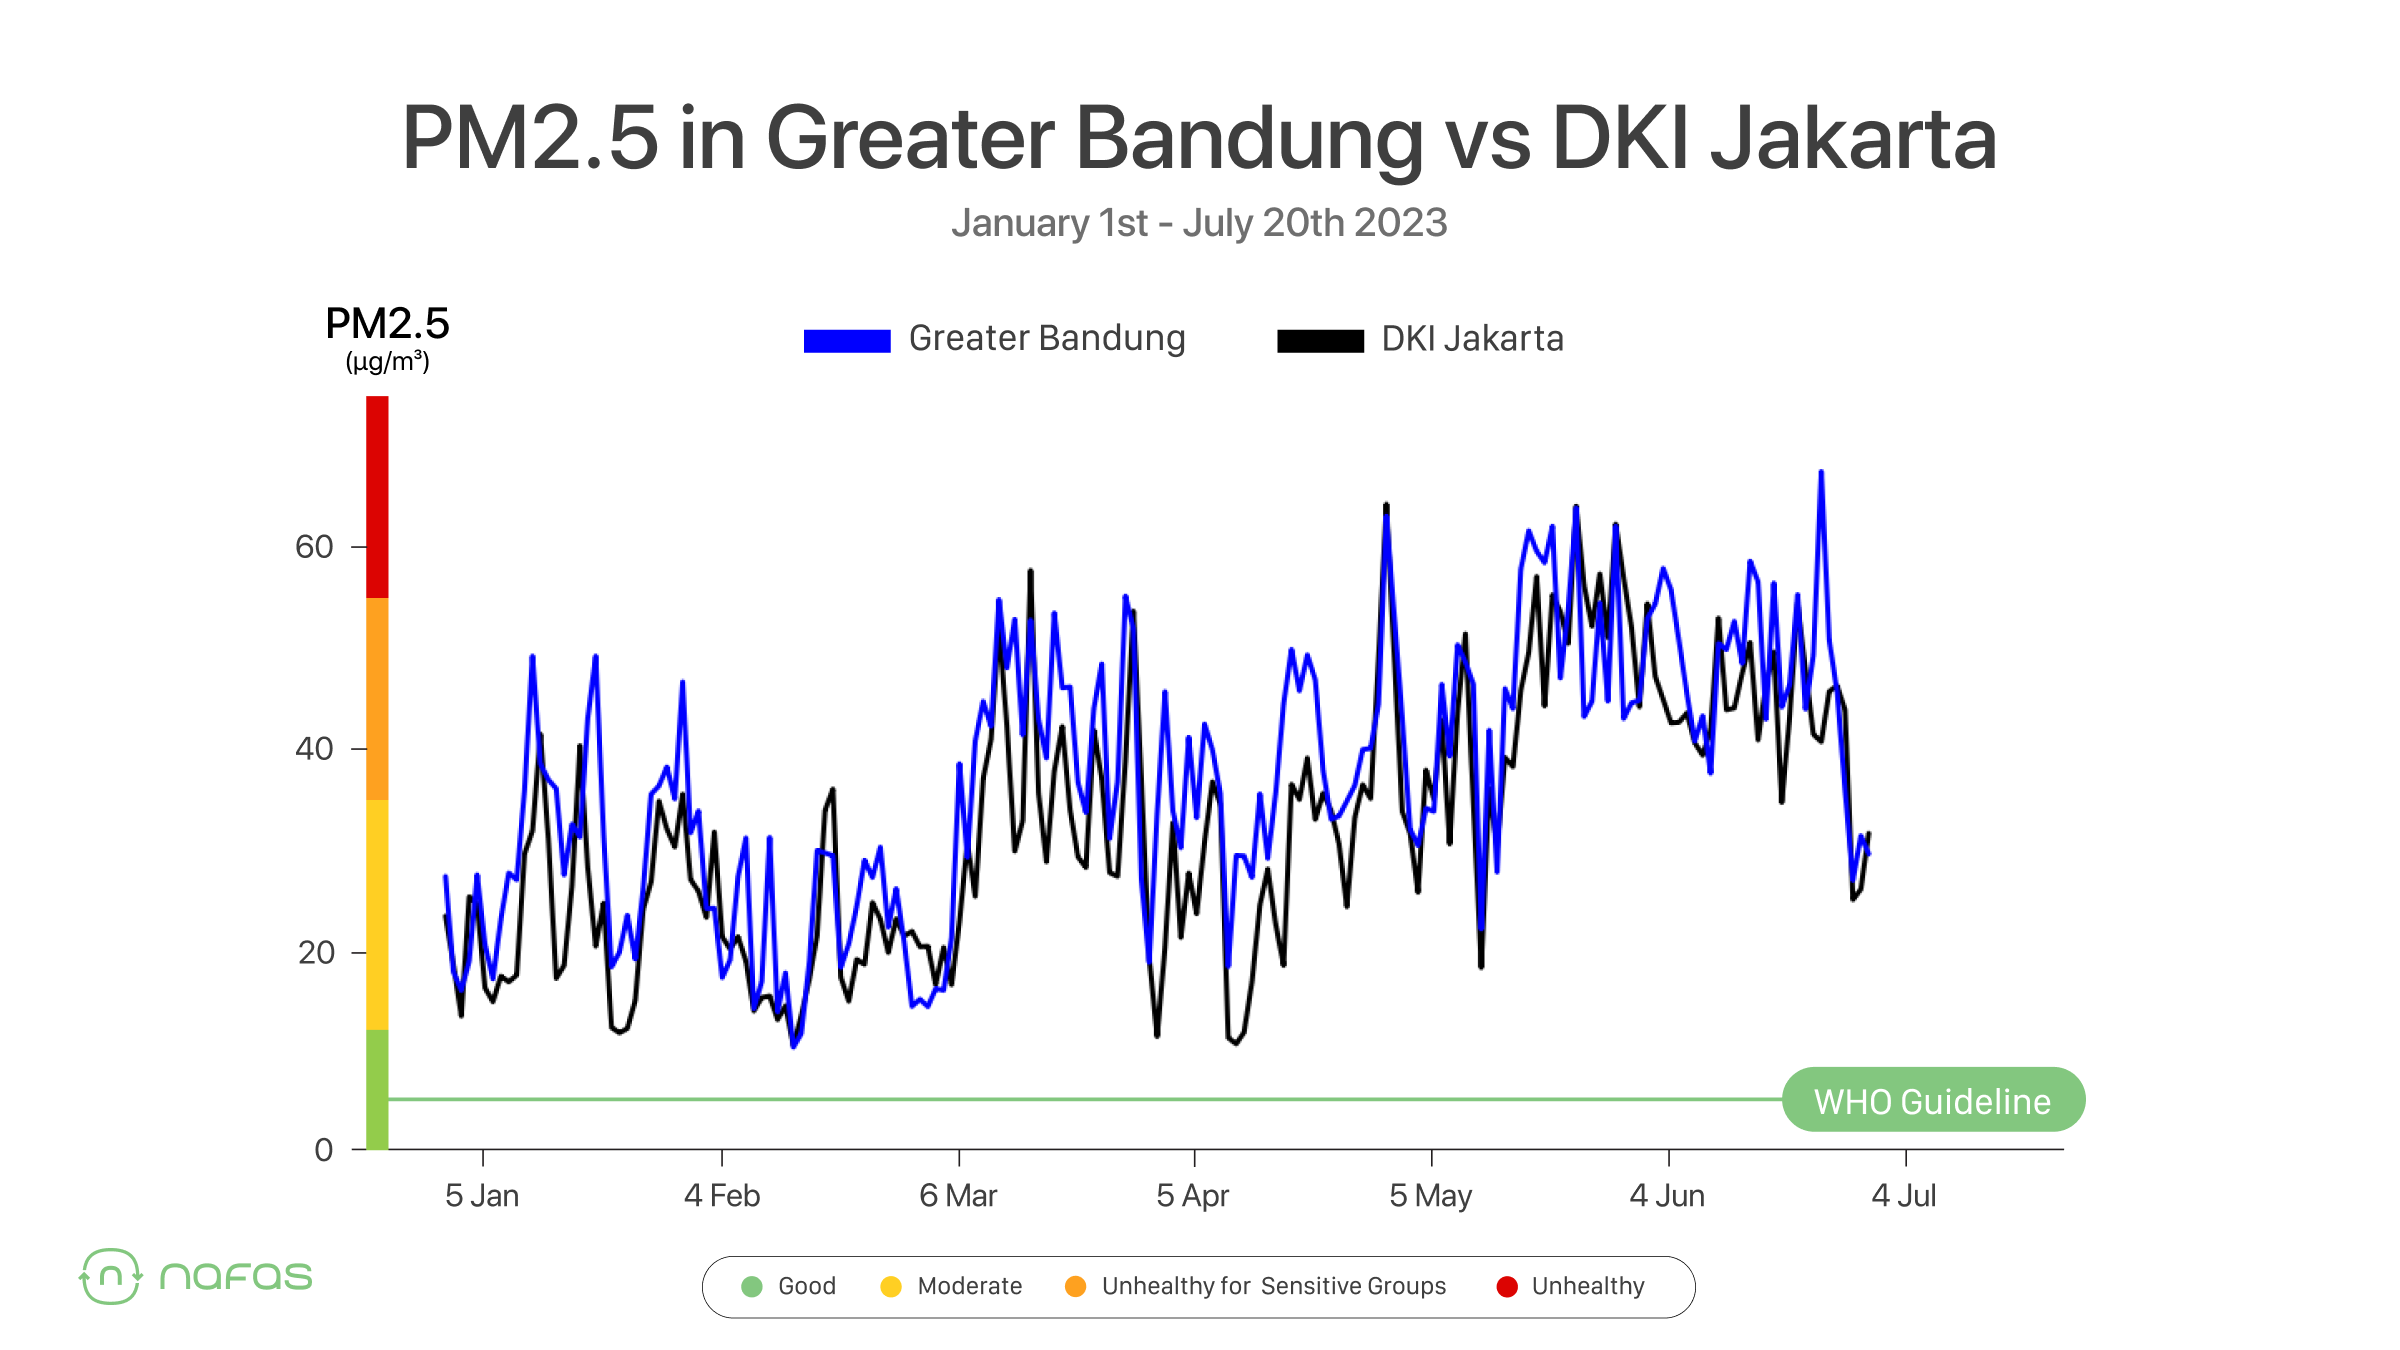
If the average air pollution in Bandung is compared to the air pollution in Jakarta, it turns out that the pollution in Bandung is worse. From the line graph above, the blue line (Bandung) is almost always above the black line (Jakarta). On average, the amount of PM2.5 in Bandung reaches 37 μg/m3 and is qualified as 'Unhealthy for Sensitive Groups', such as children, pregnant women, and the elderly. This far exceeds the WHO recommended standard of 5 μg/m3.
🫁 Bandung is dominated by unhealthy air to breathe
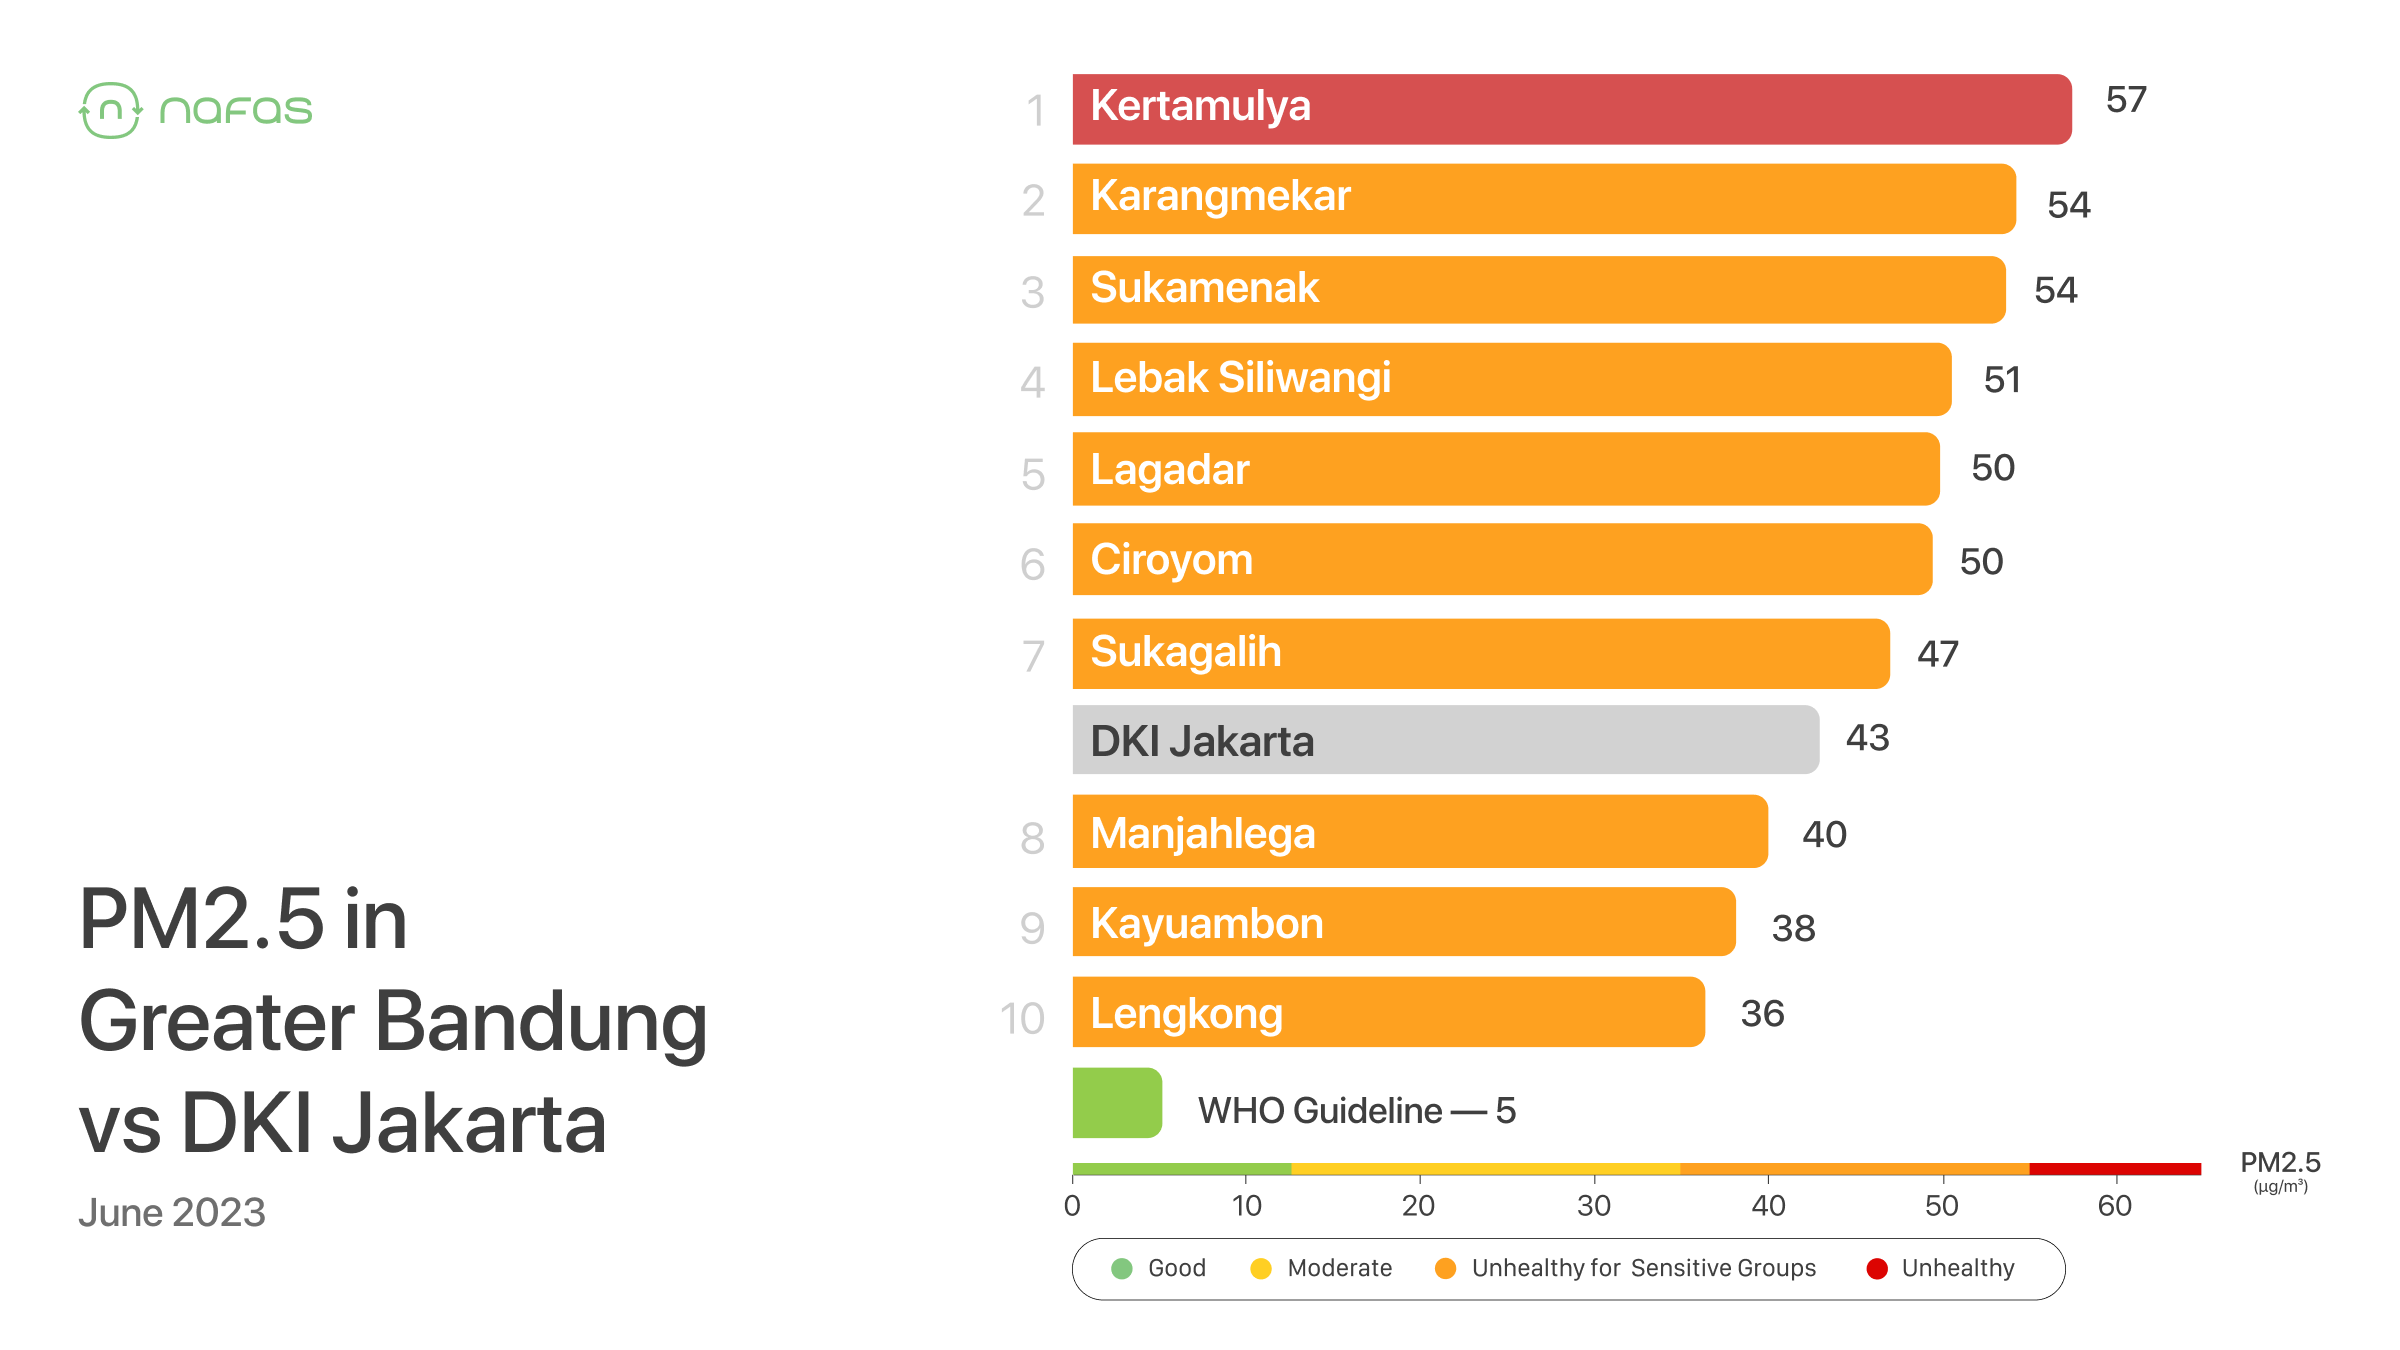
In June 2023, it turns out that all locations in Bandung installed by the Nafas sensor had unhealthy air quality. The variation of pollution in Bandung shows that there are several factors that influence the fluctuation and distribution of air pollution: hyperlocal and indigenous pollution, people's activities, local climate, and Bandung's topography.
Let's explore the air quality in each area in more detail! 👀
🏘️ Kertamulya (The Most Polluted Area)
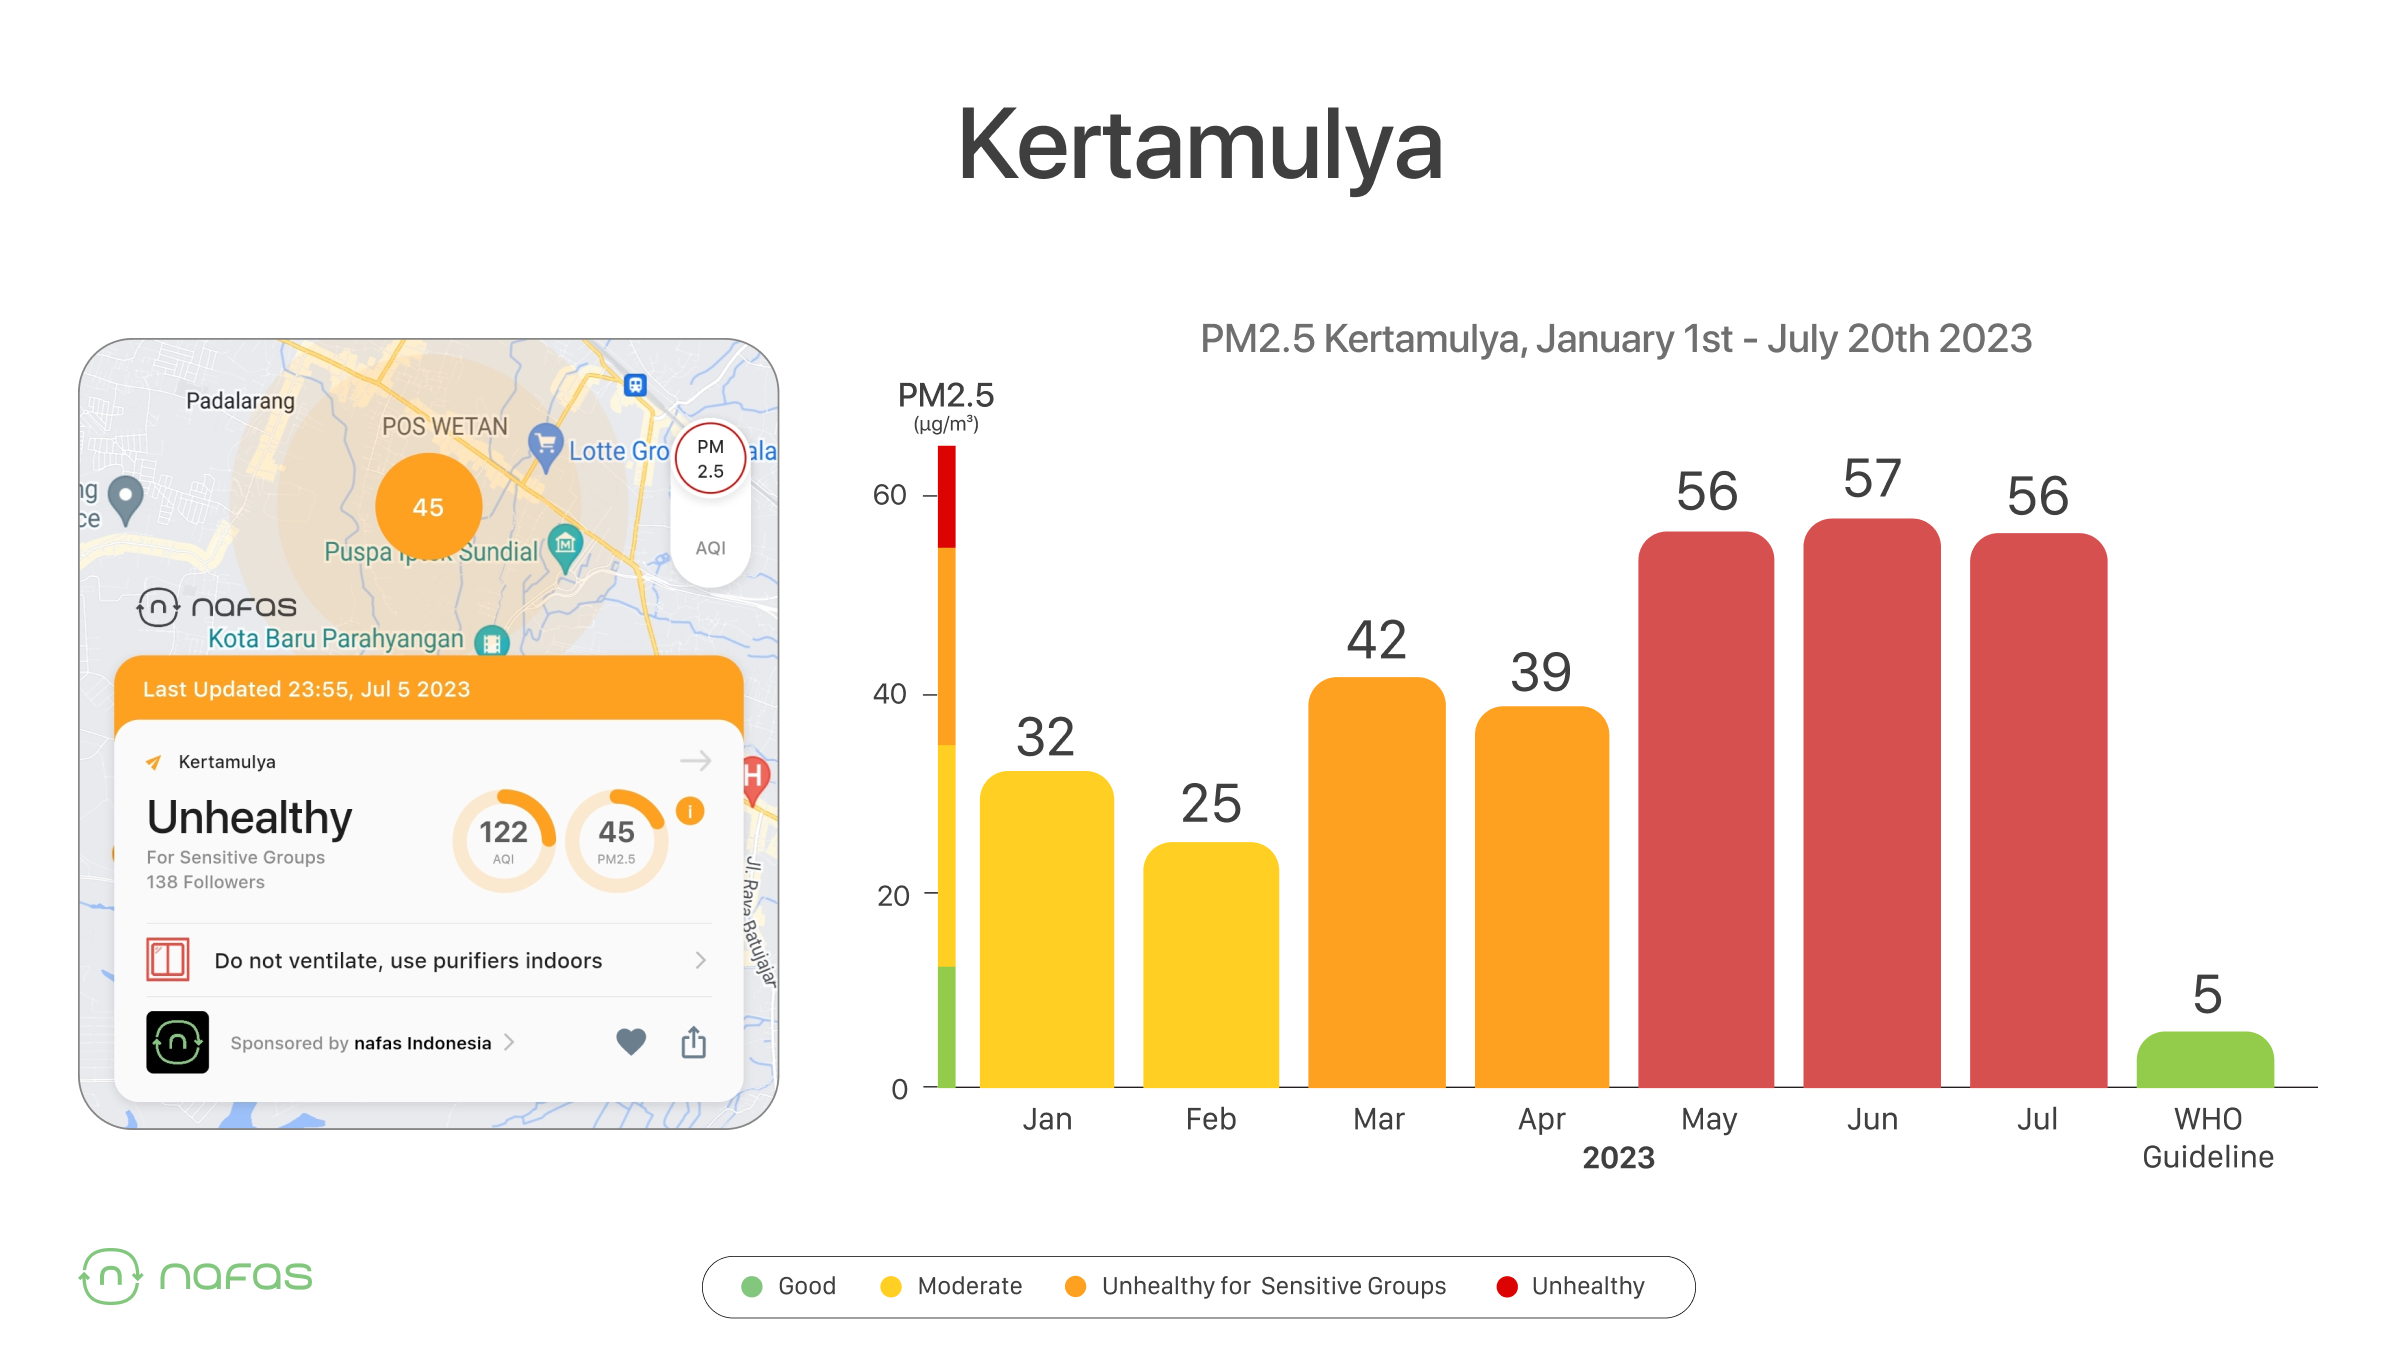
Kertamulya is the location with the worst air quality recorded by Nafas in June 2023. The worst air quality period for Kertamulya occurred from May to July 2023. From April to May, PM2.5 pollution increased dramatically compared to previous months.
🏘️ Karangmekar
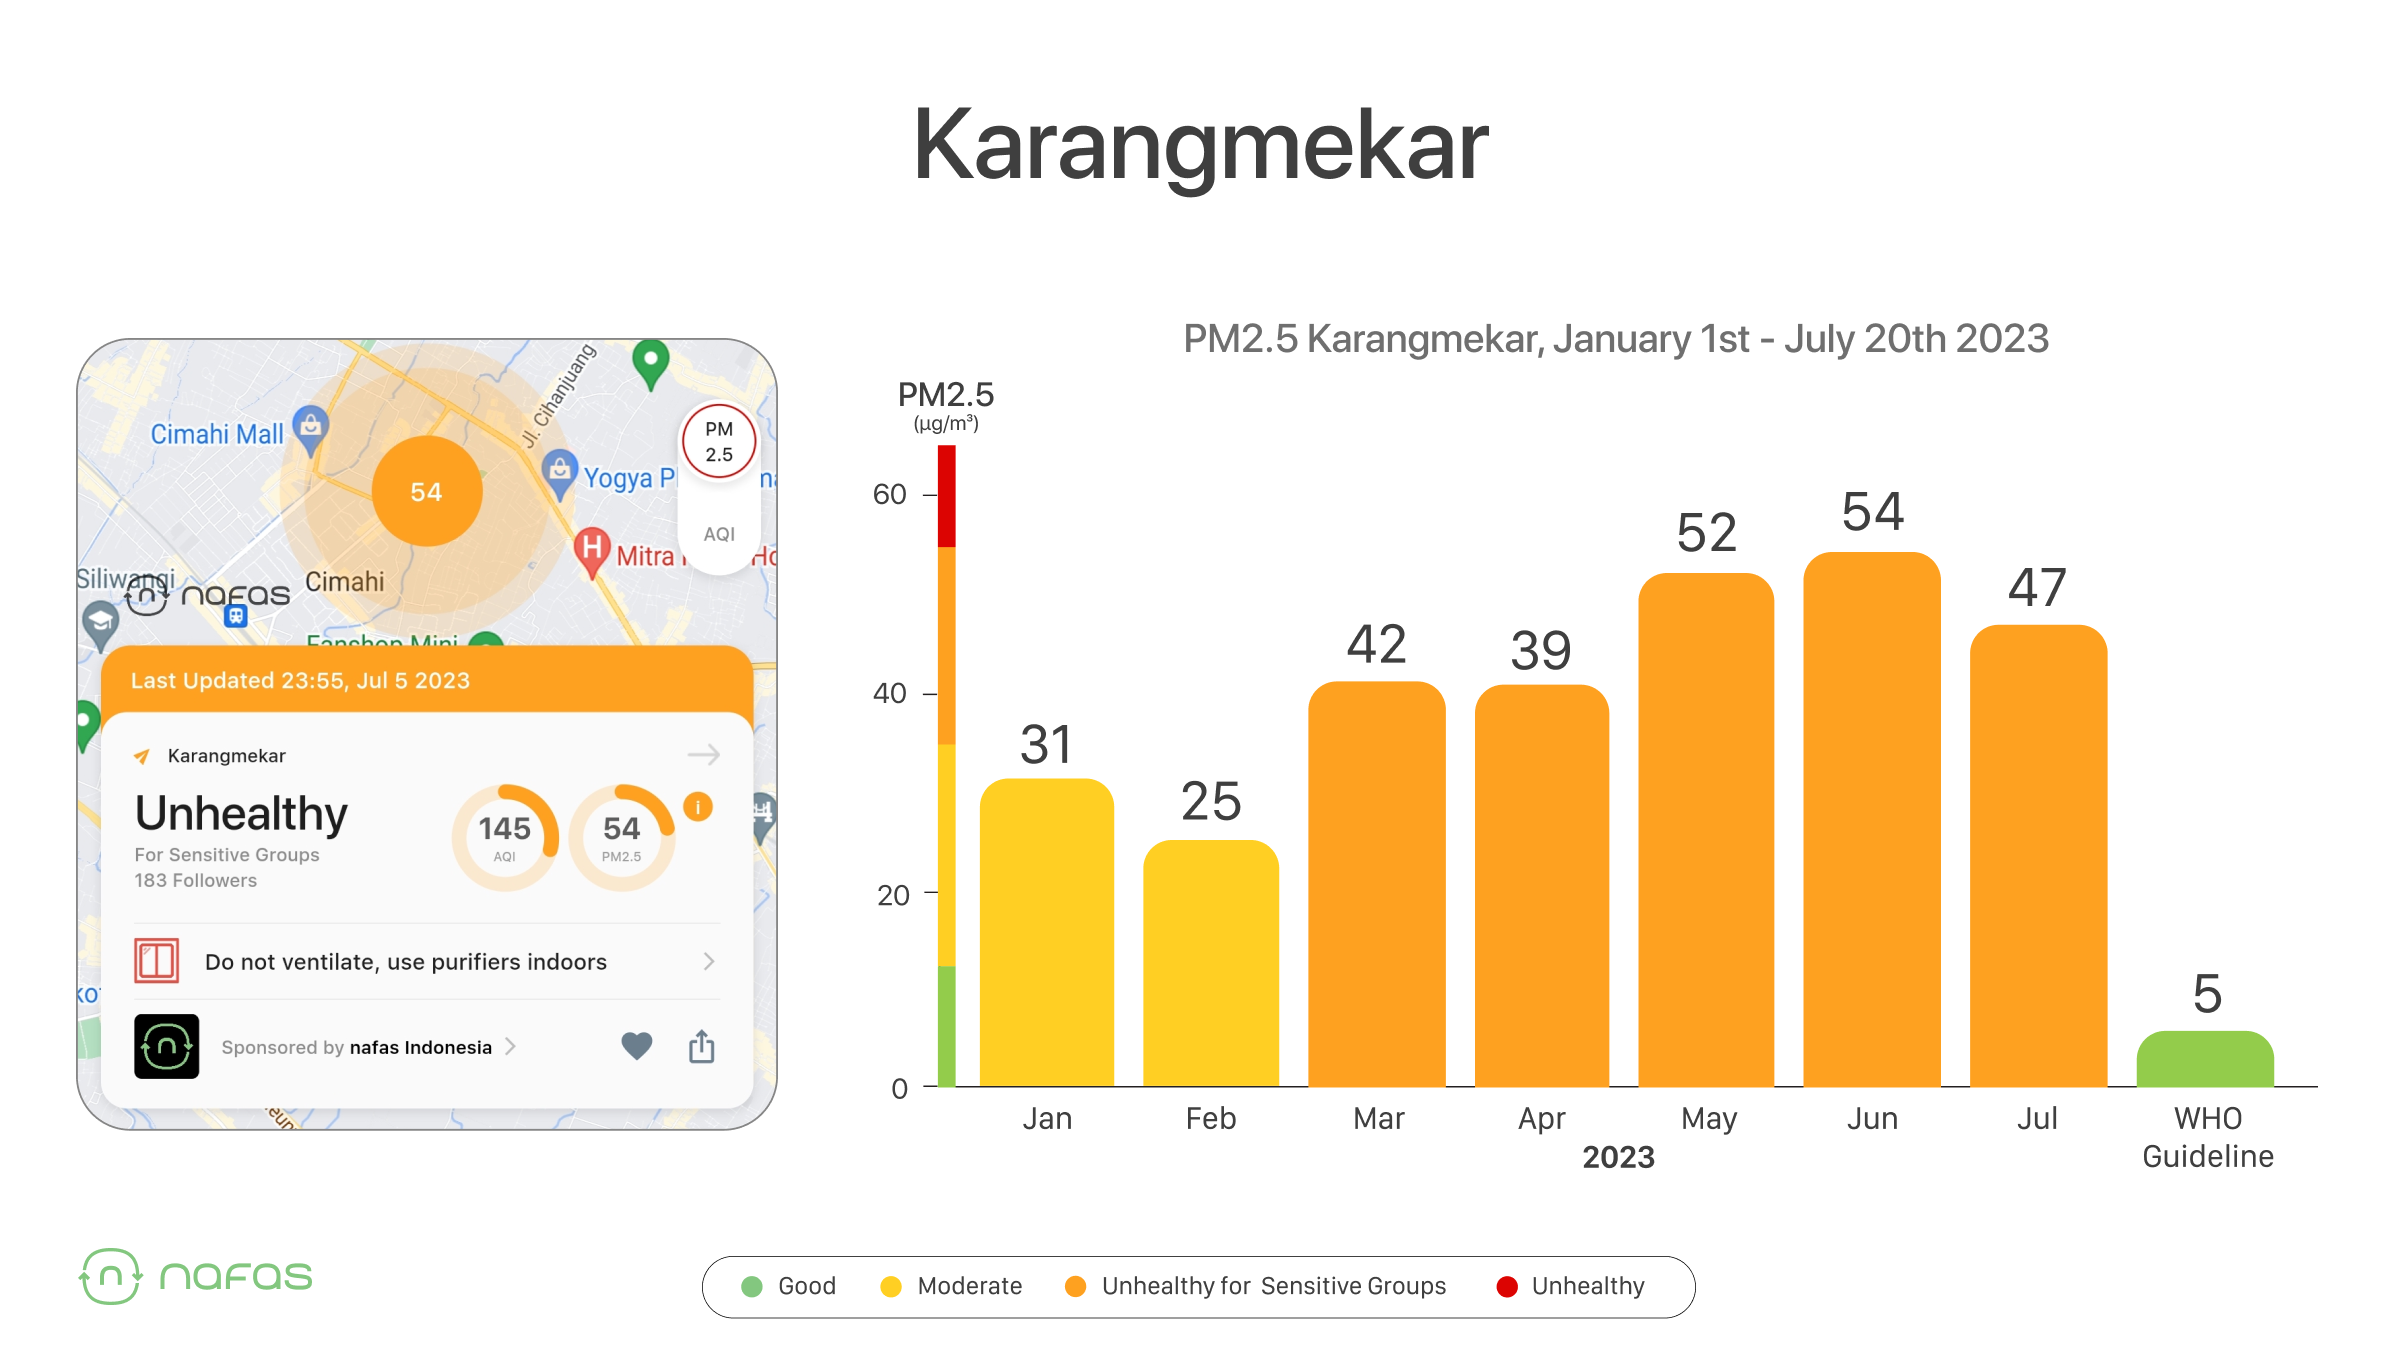
Being second after Kertamulya apparently makes Karangmekar residents breathe air above the average WHO annual safe exposure limit (5 μg/m3).
🏘️ Lebak Siliwangi
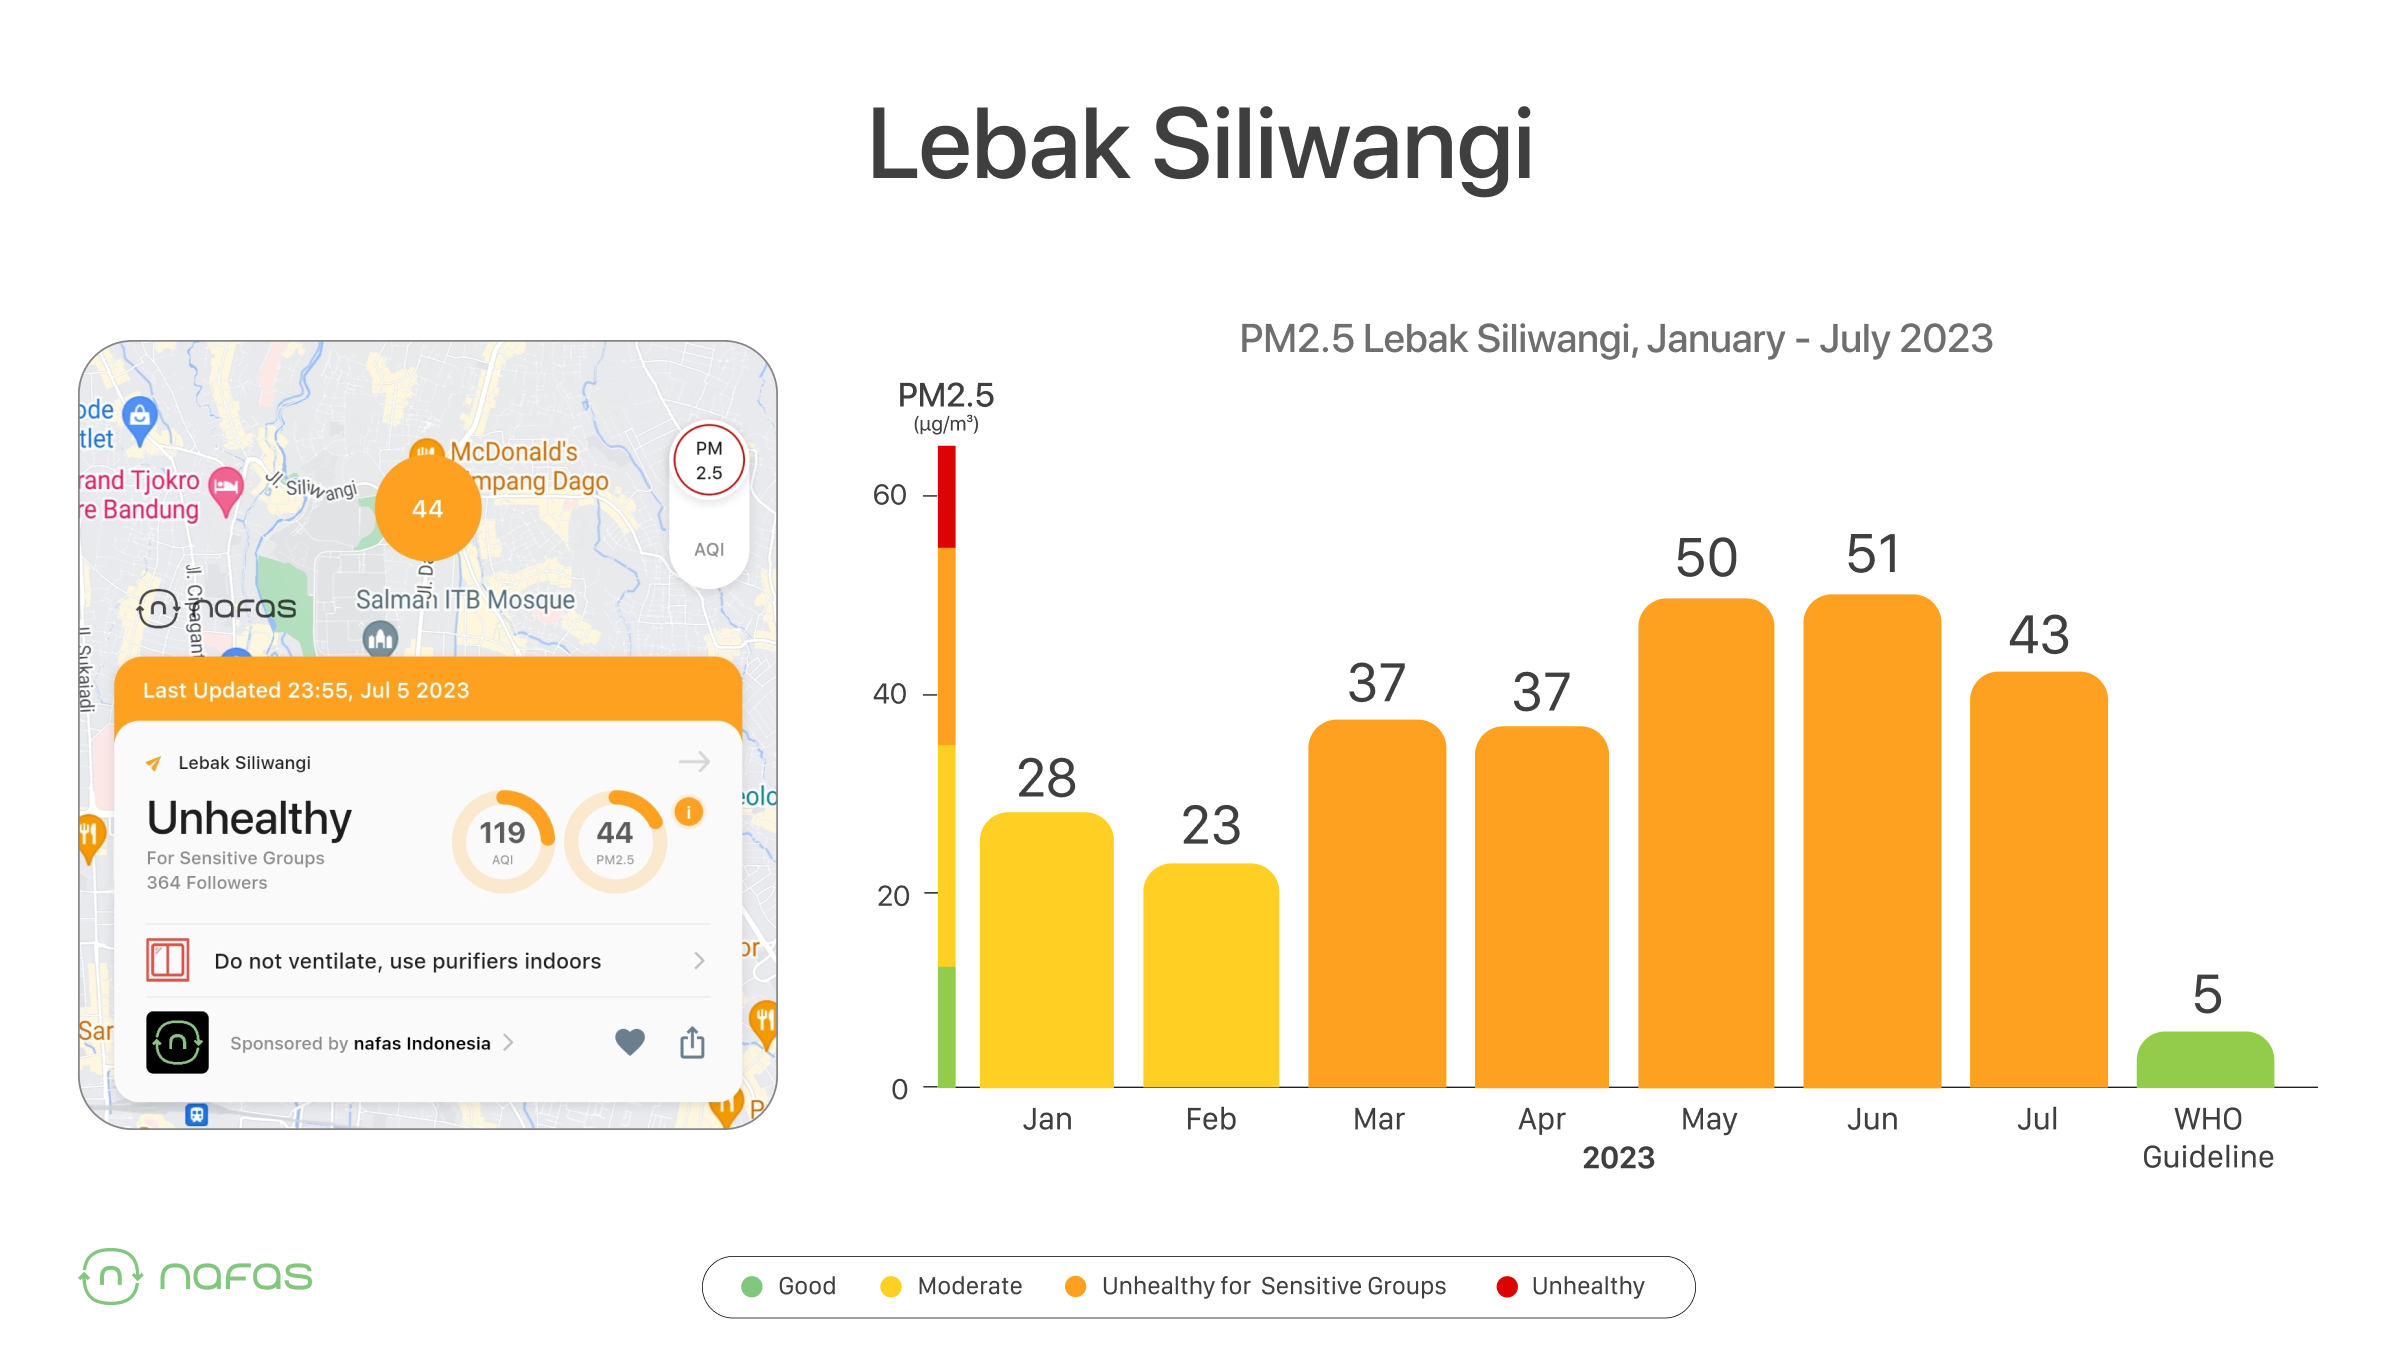
The air condition in Lebak Siliwangi is, in fact, not much different from Karangmekar. With a similar trend, people enjoy good air quality only in January and February. The air quality has consistently deteriorated since March, and never improved until July.
⚠️ Pollution in Bandung increases from evening to morning
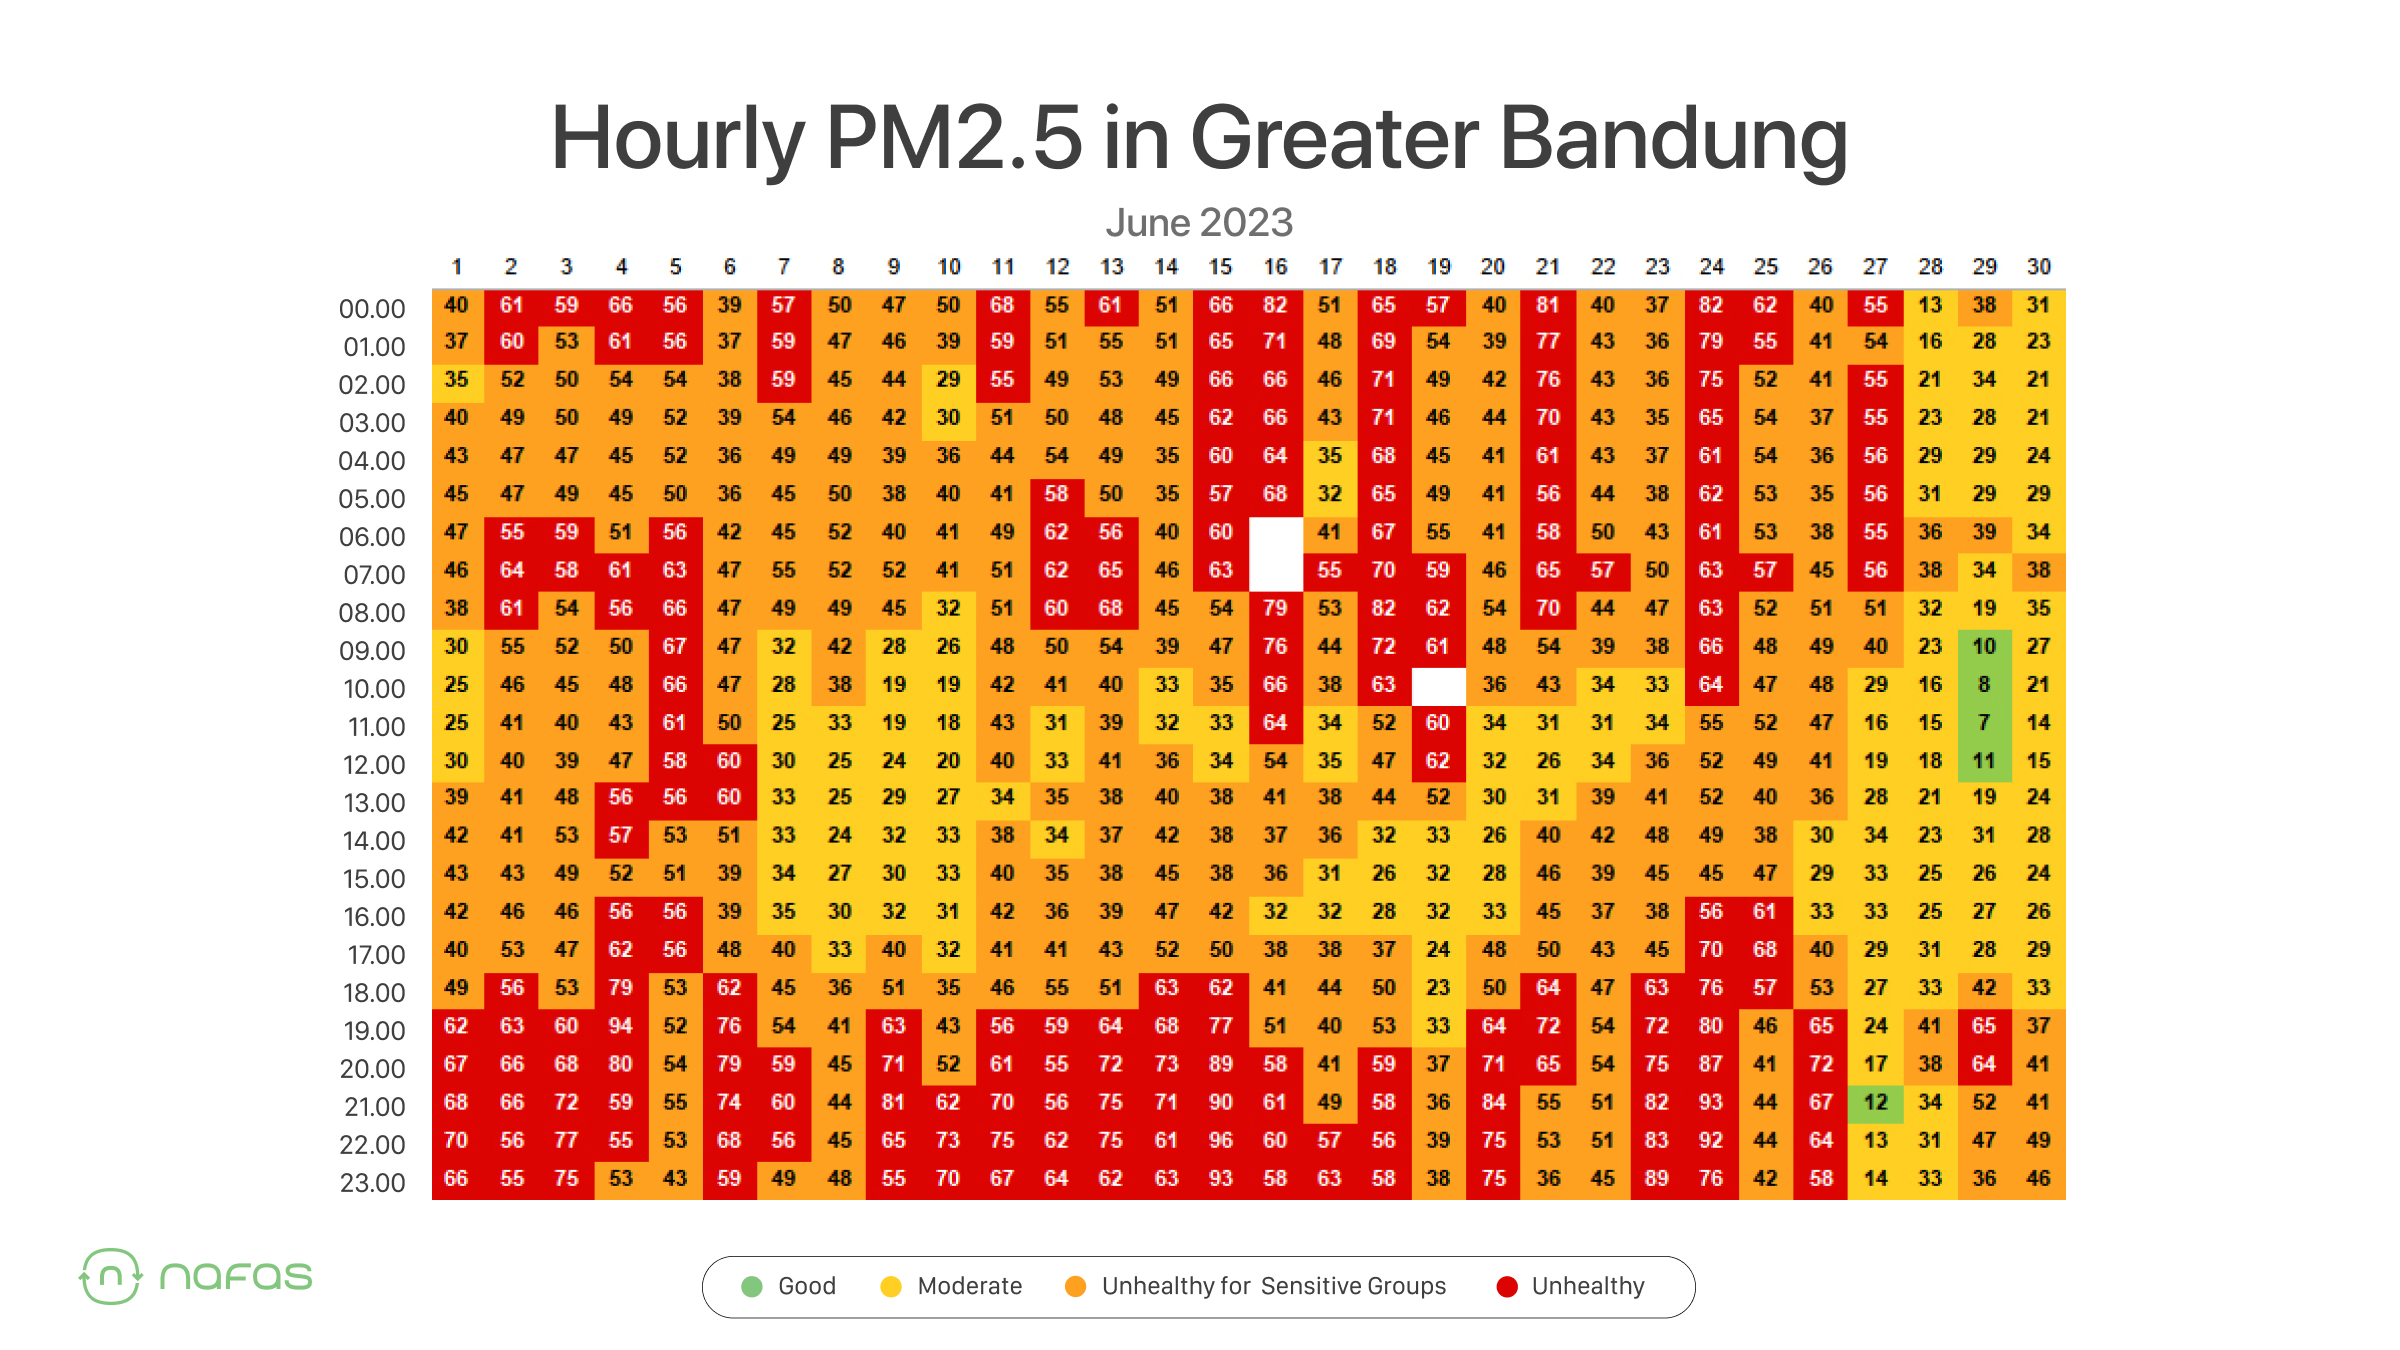
The image above shows the average hourly PM2.5 amount during June 2023 in Bandung. If you notice, the number of red squares looks concerning, right? During June, the average pollution level increases from late afternoon to early morning, between 4 PM - 8 AM. Therefore, sunbathing babies or exercising outside in the morning when pollution levels are high should be avoided.
For mothers with newborns and people who suffer from asthma and allergies, the Nafas team recommends regularly checking air quality before doing activities outside because air pollution easily leads to respiratory diseases. A study in Greece in 2021 showed a 32% increase in pediatric ER visits related to upper respiratory tract infections when PM2.5 reaches or is above 25 μg/m3. (Kanellopoulos et al., 2021)—read the article here.
In short, Bandung's chilly temperatures do not guarantee that the air is clean and healthy. This is proven by the high level of pollution in various areas of Bandung every day.
😷 Can we reduce our exposure to air pollution?
Absolutely! While it is difficult to control all sources of air pollution, we can always limit our exposure to air pollution from now on. Here are the steps you can take to avoid exposure:
1) Monitor air quality regularly on the Nafas app
2) If the air quality is poor, avoid outdoor activities.
3) Always wear a mask when going out. [Dr. Citra Amelinda]
"Children over 2 years old can wear a mask (cloth mask or disposable mask) that fits over the nose and mouth." - dr. Citra Amelinda
4) Close doors and windows when air quality is poor. Using an air purifier can help clean the air indoors.
Reference:
H. Salsabila, et al. Estimation of the Spatial Distribution of Maximum PM10 and PM2.5 Concentration in Bandung City and Surrounding Countries Using WRF-Chem Model (Case Study in July and October 2018). Vol. 893, no. 1, 1 Nov. 2021, pp. 012044–012044, https://doi.org/10.1088/1755-1315/893/1/012044.